Correlation with BTC Is Not a Life Sentence. 10 Tokens Tied to Their Own Business
Altcoin correlation with Bitcoin is an axiom of the crypto market. But correlation doesn't mean inevitability. We calculated Pearson correlation coefficients between the price of 10 tokens and their product metrics (fees, volumes, revenue) over the period from October 2025 to May 2026. The result: for all 10 assets, the link to their own product is stronger than the link to BTC. Below: the data, the charts, and the reasons behind it.

The Problem of Bitcoin Dependence
The 2021 era was a time of pure narratives: NFTs, metaverses, Move-to-Earn, DAOs, GameFi. Money flowed into a project when all that existed was a whitepaper and a couple of slides. Tokens started trading on exchanges before the first users even showed up.
The market was buying promises, not profit. And market cap outran revenue, or existed without any revenue at all.
Back then, people called it the "new economy". Today we understand it was an economy of hope.

The overwhelming majority of projects still play by the same rules. Their price is tied not to fundamentals but to market sentiment: when Bitcoin rises, they follow, and when it falls, they crash twice as hard. A protocol can multiply its revenue and user base many times over, and that changes nothing about its valuation, because the main driver is sentiment.
That's why institutions still treat tokens with suspicion. What kind of asset has a price that doesn't correlate with the success of its own business?
That question became the starting point of our research. We set out to understand whether projects exist where the coin's price depends solely on the product, not on Trump's tweets, the Fed's rate decisions, or BTC's price action, but on the real money the protocol itself generates.
This question lands hardest in the UAE. Institutional allocators in Dubai and Abu Dhabi work inside the VARA and ADGM regimes, where a token's economics have to be documented and defensible rather than narrated. When a compliance team asks what actually backs a token's value, "market sentiment" is not an answer that survives review.
Research Methodology
To test this, we selected ten leading protocols in the DeFi and AI segments. We used the following product metrics:
- protocol fees,
- trading volume,
- net profit,
- compute payment turnover.
We calculated the Pearson correlation between the day-to-day change in the token and the day-to-day change in the key product metric. Data was taken from October 2025 to May 2026.
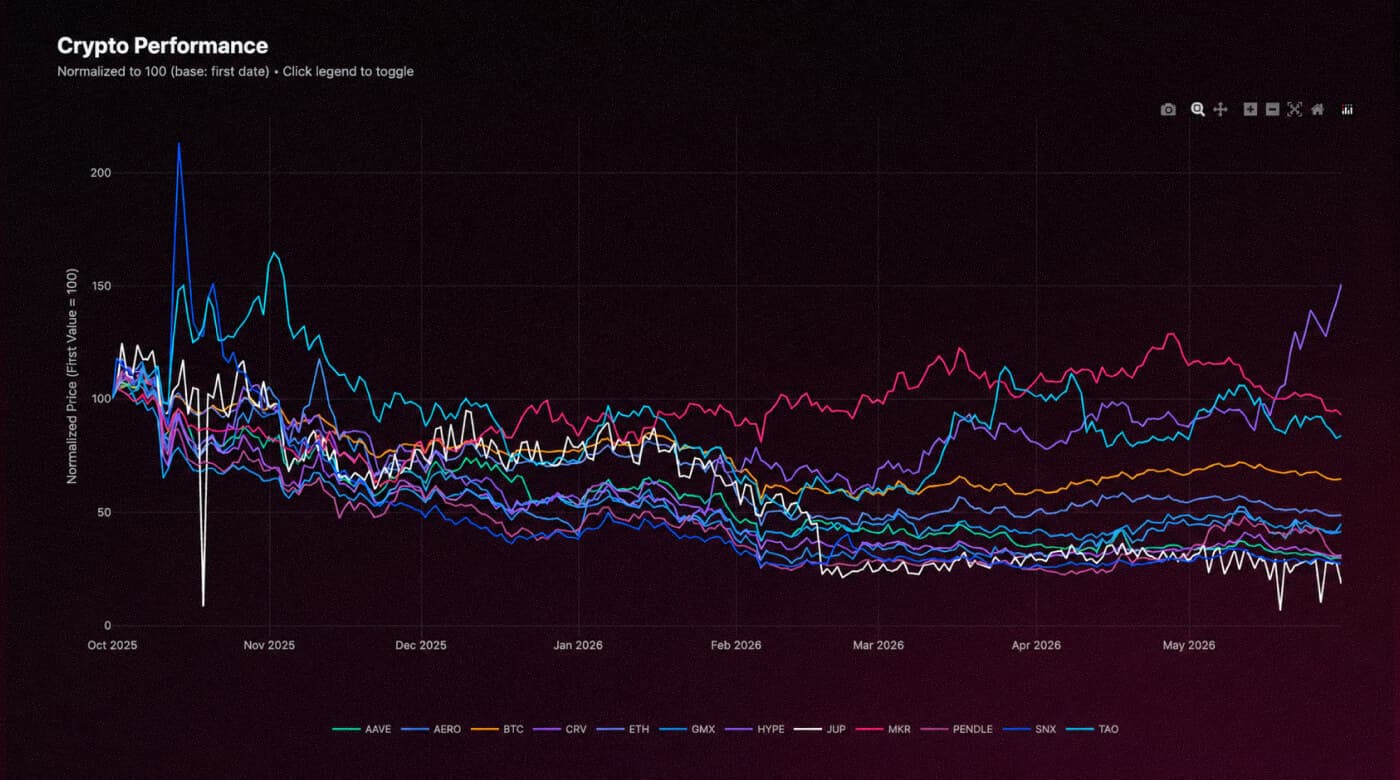
Price history of the tokens in the study, normalised to 100. October 2025 – May 2026. 8Blocks calculations based on DefiLlama data
We used percentage changes rather than absolute values. This removed the influence of broader trends and let us see how the market reacts to everyday fluctuations in on-product activity.
The initial forecast assumed only isolated outliers, but the actual picture turned out to be different.
Why This Time Period
As our starting point, we deliberately chose the most difficult and revealing period: fall 2025. Over that stretch, the market went from euphoria to panic, from Bitcoin's all-time high to a brutal correction.

The key moment was October 10. The introduction of new US trade tariffs crashed the market and triggered the largest wave of liquidations in crypto history.
Positions worth tens of billions of dollars were wiped out in a single day. Altcoins lost significantly more than Bitcoin, which is exactly what you'd expect from assets without fundamentals.
In a rising market, everyone looks like a genius. When Bitcoin climbs, memecoins and zero-revenue projects rally right alongside it, and there's no way to tell who's actually worth something. But once a correction hits, it becomes clear who has a foundation and who's built out of cardboard.
Before we lay out the findings of our research, we first need to break down the edge cases where token movements stop syncing with the product's success.
Three "Correlation Killers"
A strong correlation between product usage and token value is more the exception than the rule. In many projects, this link weakens over time or disappears altogether, usually for one of three reasons.
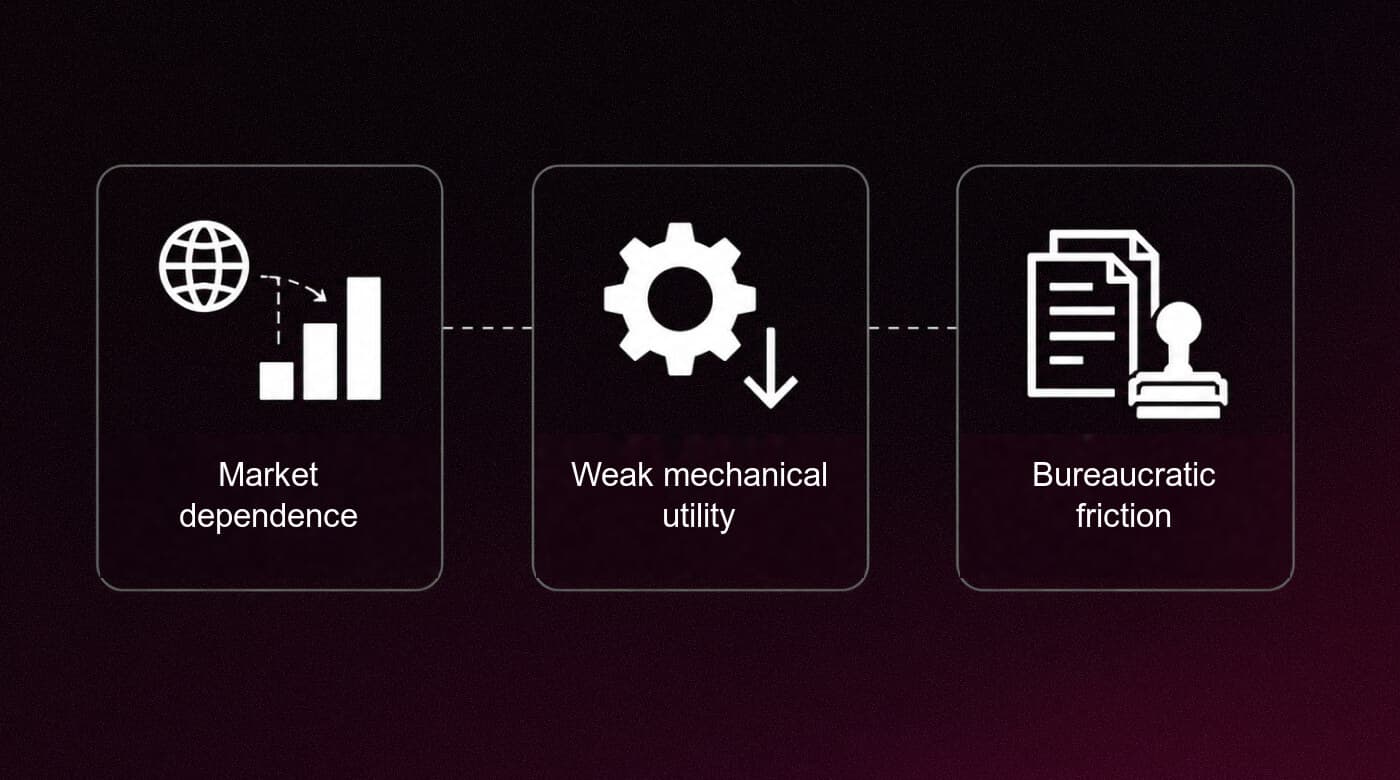
1. Market dependence
The token's price falls along with the broader market, even if the product itself is performing flawlessly. This happens when its key metric (trading volume, for instance) is itself sensitive to market sentiment.
A price drop during a bear phase often masks the product's actual state. Users aren't leaving a specific protocol, they're leaving the market as a whole. Activity falls, the token follows Bitcoin down, and the project's genuine achievements simply get drowned out by the broader downturn.
2. Weak mechanical utility
The token isn't tied to product usage through hard mechanics. If it's only needed for voting or gives a small discount rather than being a mandatory means of completing transactions, growth in product activity doesn't translate into price growth.
Correlation can't emerge where there's nothing feeding it.
3. Bureaucratic friction
Even when a product generates revenue that should, in theory, support the token (through burns, profit distribution, or reduced emission), putting those mechanisms into action requires votes or lengthy approval processes.
The lag between revenue showing up and the resulting action actually taking place breaks the timing link, and the correlation disappears.
How the studied tokens correlate with each other
It's also useful to look at the broader market picture.
The matrix below shows the correlation between daily price changes of all the studied tokens for the period from October 2025 to May 2026. The closer the coefficient is to 1, the more often the two assets moved in the same direction.
Values close to 0 indicate a weak relationship, while negative correlation means the assets' dynamics diverged more often.
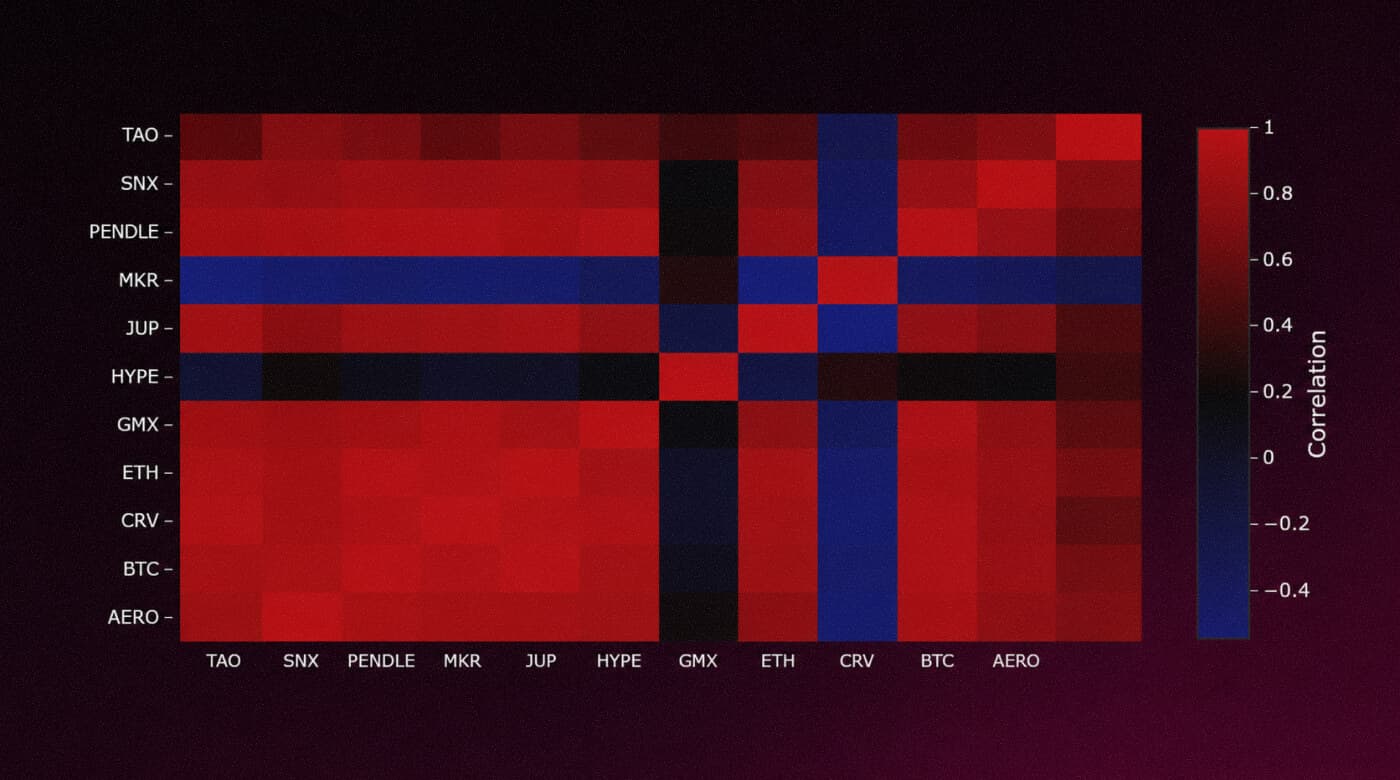
Correlation matrix of daily price changes. 8Blocks calculations based on DefiLlama data
This visualization doesn't show a token's link to its product. Instead, it lets us see how much the studied assets depended on each other and on broader market trends.
This is why some projects, such as HYPE or SKY (MKR), stand out from the rest: their price dynamics matched the movement of most large crypto assets far less.
Next, we'll break down which product mechanisms allowed these tokens to achieve this relative independence from the market.
Results: correlation coefficient across 10 projects
We ranked the projects by correlation strength, from highest to lowest. The higher the number, the more the price depends on the product rather than on Bitcoin.
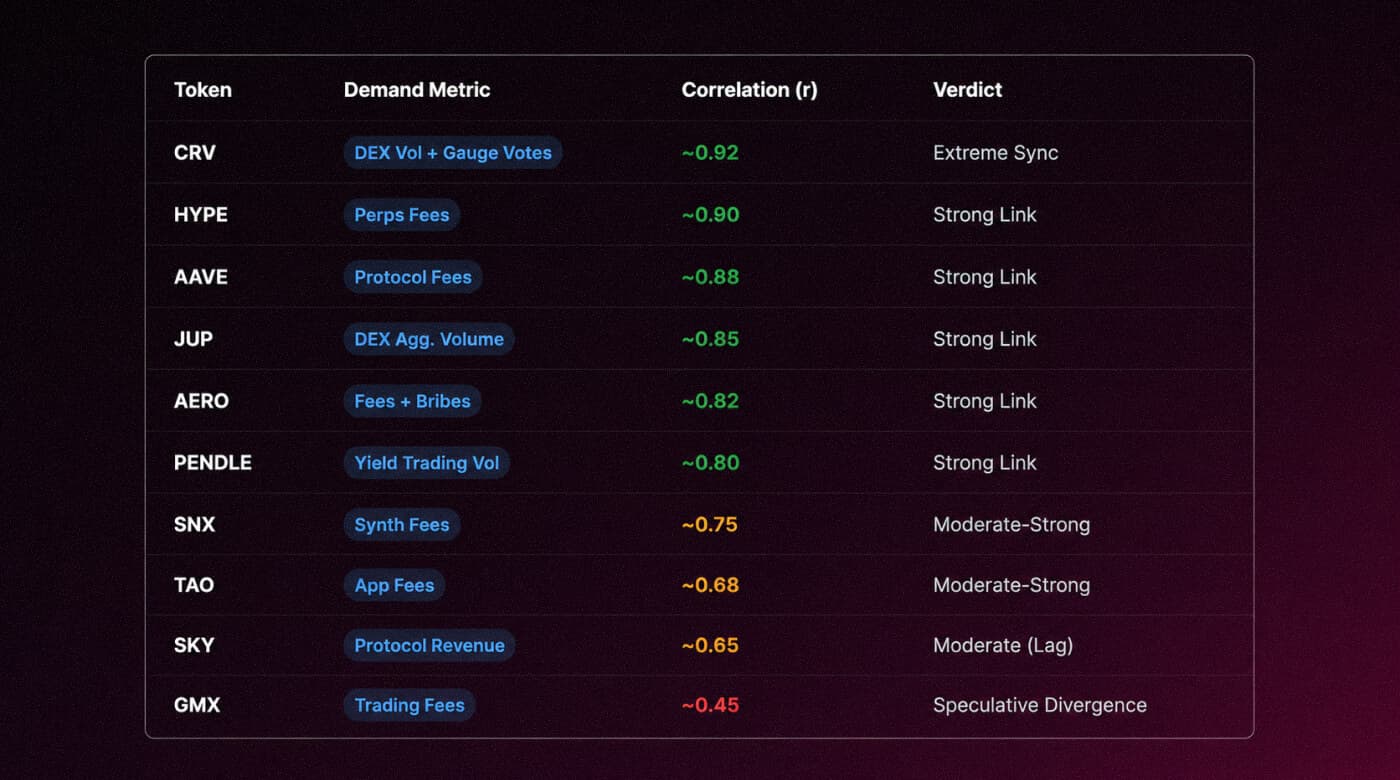
Correlation coefficients between price and product metric across the 10 projects. 8Blocks calculations
CRV (Curve Finance) — correlation ~0.92
What it is: an exchange for swapping stablecoins (USDC, DAI, USDT, and other stable coins). It lets you swap them with virtually no losses and minimal fees.
The token's price turned out to be closely tied to trading volume on the Curve exchange, a metric that drives protocol fees and reward distribution via the gauge voting system.
The mechanism works like this: users lock CRV, turning it into veCRV, and vote on which liquidity pools receive the larger share of emissions. The higher the trading volume in a given pool, the more valuable the voting right for it becomes.
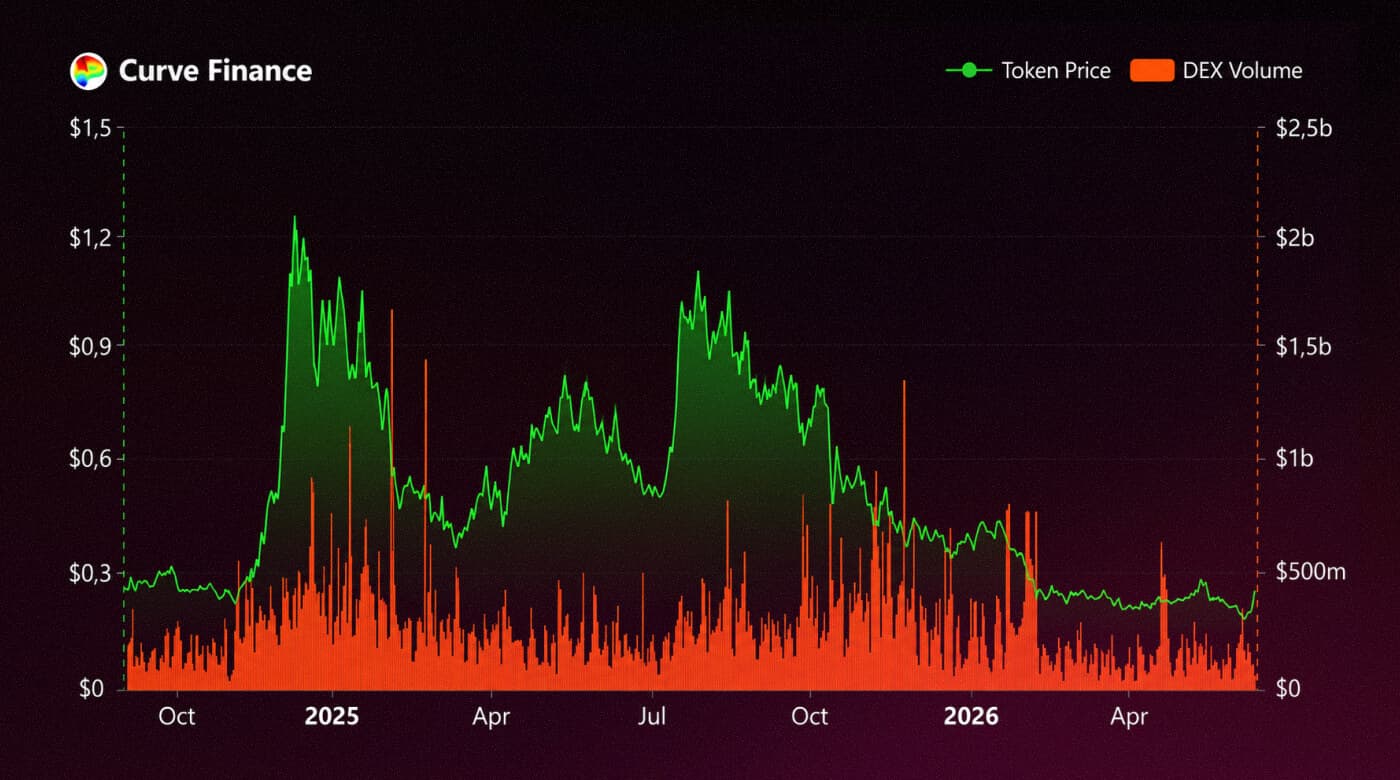
Curve Finance: CRV price and DEX volume. Source: DefiLlama
The result is a closed loop: rising trading activity automatically increases the economic value of holding the token.
The effectiveness of this model is confirmed by the fact that it spawned an entire separate market. Convex Finance, a multi-billion-dollar protocol, was built purely to optimize veCRV management. One mechanism gave rise to a whole ecosystem.
In the fall of 2025, when Bitcoin corrected by more than 15%, most altcoins collapsed along with it. CRV behaved differently. Its price declined noticeably more gently, because it tracked not market panic but real trading activity within its own protocol: stablecoin swap volumes on Curve stayed stable.
As a result, the correlation between the token's price and DEX volume reached one of the highest levels in the entire sample.
That said, the model is too complex for newcomers
Bribes, veCRV, gauge voting: understanding all of this takes time, and many users simply don't want to dig in.
If part of the fees were distributed automatically without all this voting, it could attract more regular users and increase the inflow of money into the protocol.
— 8Blocks Team
HYPE (Hyperliquid) — correlation ~0.90
What it is: a perpetuals exchange with its own layer-1 blockchain, where you can trade not just crypto but also oil, gold, and currencies.
Here, the key metric is protocol fees: they're what ties HYPE's price to real product usage.
99% of all trading fees automatically go toward buying back HYPE from the market. This means that as soon as users start trading more actively, fees rise, and the protocol immediately starts buying back tokens.
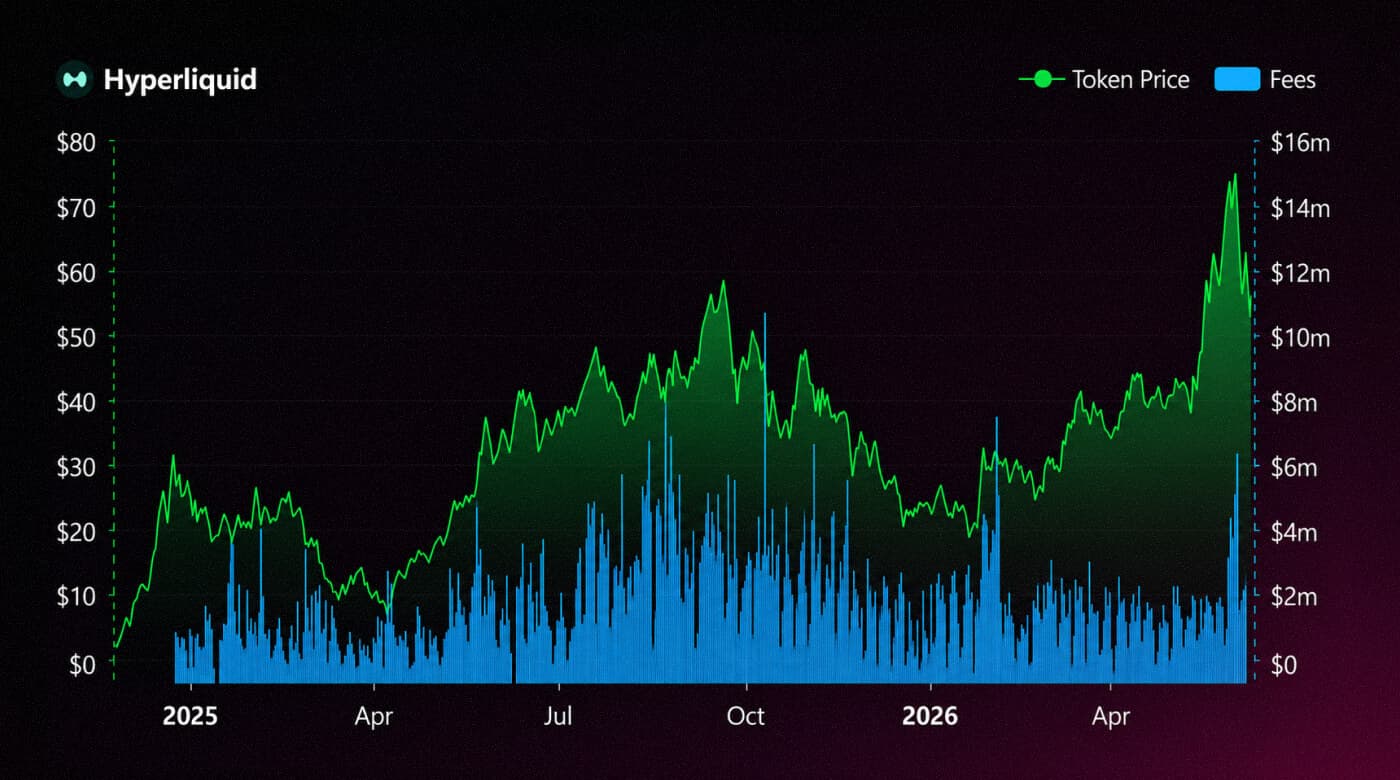
Hyperliquid: HYPE price and protocol fees. Source: DefiLlama
HYPE isn't needed only for buybacks. Without it, you can't run a validator, launch a new market, or take part in governance. The token is built into the platform's operation, not something that exists separately.
In October 2025, Hyperliquid launched HIP-3, which added new capabilities for users. Activity on the platform grew, fees increased, and automatic buyback volumes followed suit. This helped HYPE hold up better than most altcoins.
Hyperliquid virtually eliminates the gap between product success and token price. Users trade, the protocol earns fees. The protocol earns fees, the smart contract buys HYPE. All automatically. That's why this chain creates one of the cleanest product models in the market.
AAVE — correlation ~0.88
What it is: the most popular lending protocol. You can borrow funds or deposit money to earn interest.
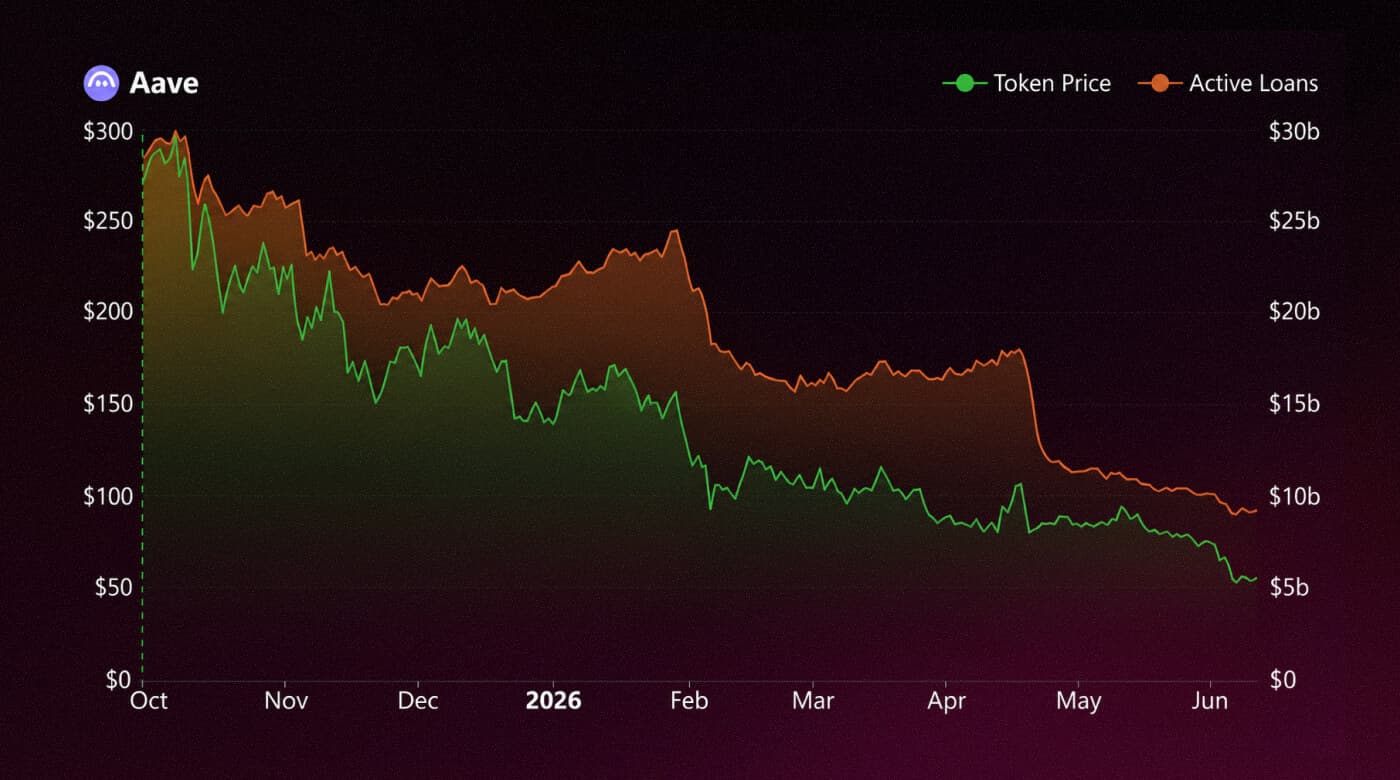
Aave: AAVE price and active loans. Source: DefiLlama
Here, everything hinges on the insurance mechanism, the Safety Module. To insure the protocol against unforeseen issues, users need to lock AAVE in this insurance pool. In return, stakers receive a share of the fees paid by borrowers. The more loans users take out, the more fees the protocol collects, and the more attractive it becomes to hold AAVE in the insurance pool.
Unlike many other lending platforms, where the governance token exists on its own, in Aave the token is directly tied to user activity.
Lending grows, staking yield grows, demand for the token grows.
During the fall Bitcoin crash, demand for loans on Aave remained stable, fees kept flowing in, and AAVE's price declined more gently than most other projects.
What could be improved
Right now, stakers in the Safety Module risk losing part of their tokens in case of problems (the slashing mechanism), but they don't always receive sufficient reward for that risk.
AAVE is a good example of how a token can be linked to a product through the distribution of economic risk. Token holders don't just take part in governance. They effectively insure the protocol with their own capital and receive a share of the income its usage generates.
— 8Blocks Team
JUP (Jupiter) — correlation ~0.85
What it is: the leading aggregator on Solana. Most of the swaps on the network route through it.
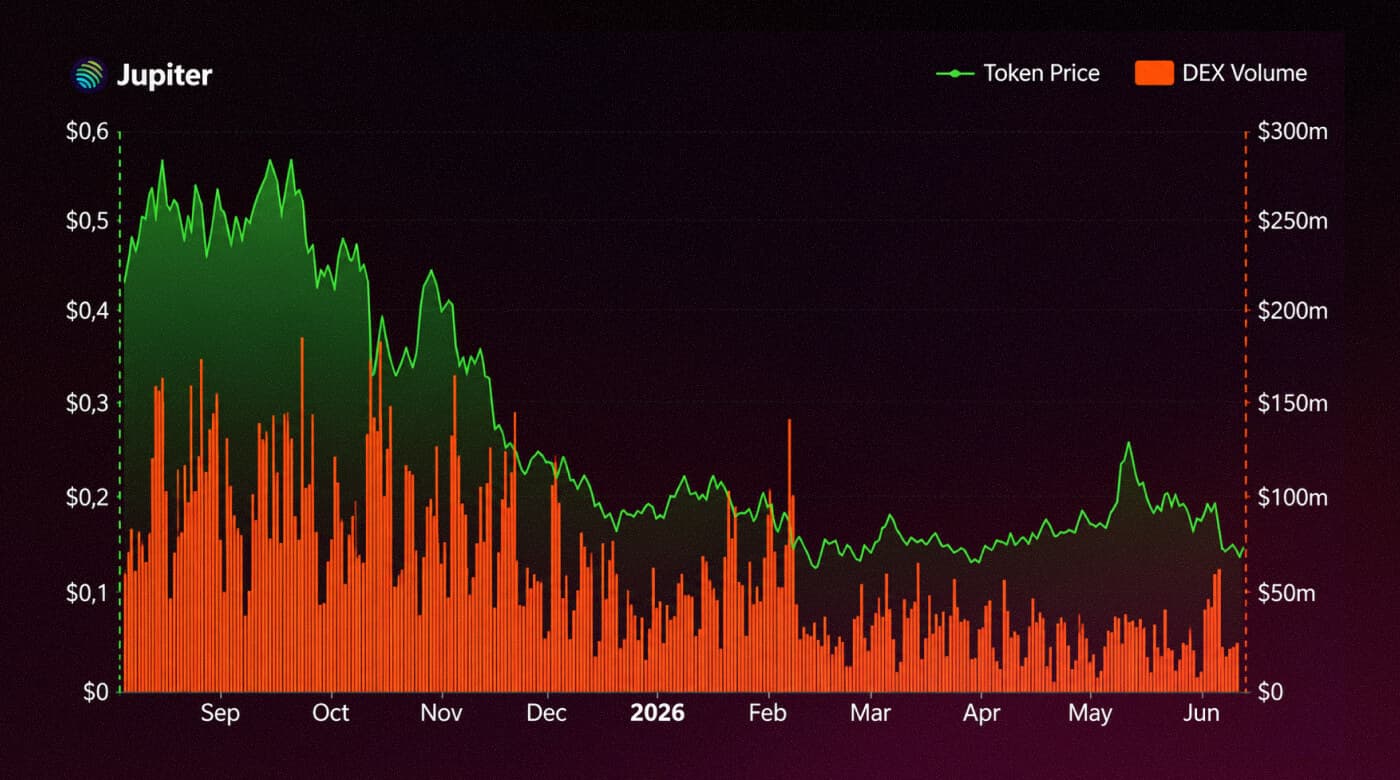
Jupiter: JUP price and aggregator volume. Source: DefiLlama
At the core of the mechanics is the LFG Launchpad, a platform through which new projects on Solana launch. To get access to these launches and receive allocations of new tokens, users must stake JUP and vote for projects. The more active the Solana ecosystem and the more interesting launches it produces, the higher the demand for JUP staking.
The token becomes a mandatory pass to early-stage projects, not just a "voting coin."
In the fall of 2025, Solana was on the rise: on-chain activity grew, and the LFG Launchpad hosted several high-profile launches. Participating in them required staking JUP. Demand for the token stayed high.
There is also room for improvement in this case
Right now all stakers receive allocations equally, regardless of how long they have held the token or how actively they participate in voting.
Introducing a reputation rating (for example, bonuses for long-term holding and activity) would encourage people to hold JUP longer and strengthen community loyalty.
— 8Blocks Team
AERO (Aerodrome) — correlation ~0.82
What it is: the leading decentralized exchange on Base (Coinbase's network).
AERO's price is tied to the veAERO mechanism. Holders lock tokens, gain voting rights, and decide which pools receive more rewards. Projects that need liquidity are forced to compete: they buy AERO or pay holders extra incentives (bribes) to vote for their pool. The more active the trading on the platform, the higher the demand for AERO.
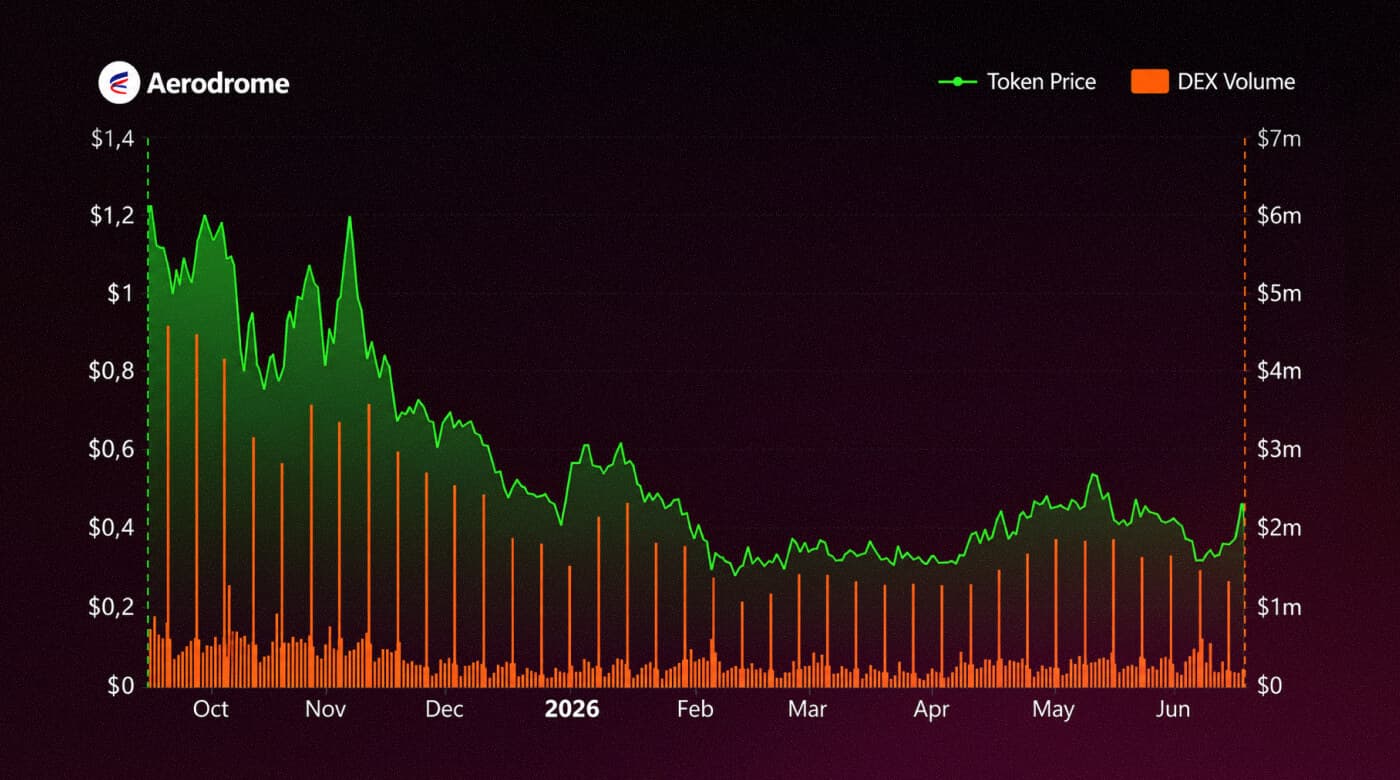
Aerodrome: AERO price and DEX activity. Source: DefiLlama
In the fall of 2025, Base was growing. Aerodrome's activity held up, projects kept competing for liquidity, and that meant AERO stayed in demand. The token held up better than many others.
The model still has room to grow
The system works well, but it favors large players. Small holders barely have a say. If they could pool their votes and passively receive a share of the incentives, that would attract more regular users. And the more people participate, the more liquidity there is, and the stronger the whole protocol becomes.
— 8Blocks Team
PENDLE — correlation ~0.80
What it is: a platform for trading future yield. You can buy or sell interest income separately from the underlying asset itself.
Say you hold an asset that generates interest. Pendle lets you split it into two parts: the value of the asset itself and the right to future interest. These parts can be sold separately. Someone wants to lock in yield now, someone else is willing to wait, and both find each other on the platform.
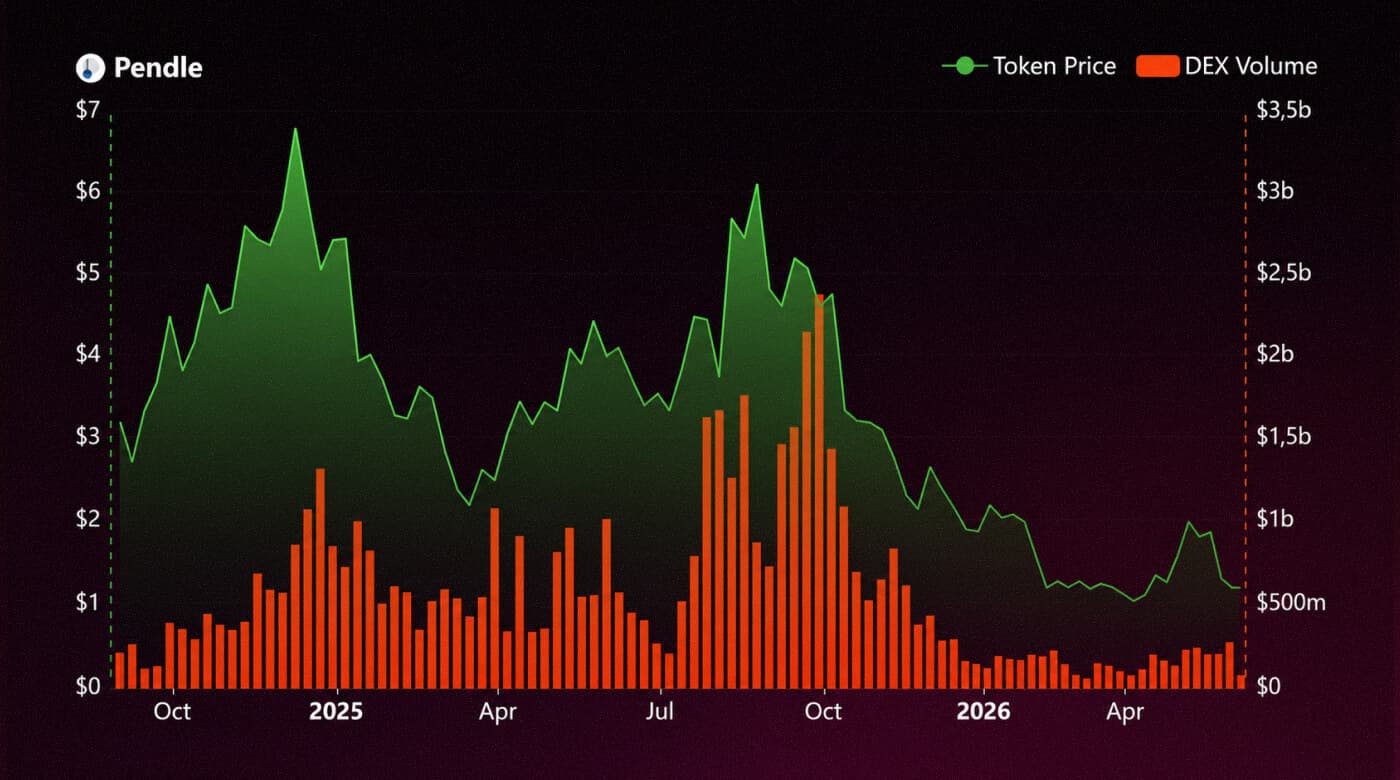
Pendle: PENDLE price and yield trading volume. Source: DefiLlama
Pendle takes a fee on every such trade. Part of that money goes to holders of locked PENDLE. The more people trade yield, the more fees accrue, and the higher the demand for the token.
But the most interesting part here isn't the mechanics, it's that Pendle doesn't depend on whether the market is rising or falling. It all comes down to demand for yield. If rates rise, new interesting assets appear, or investors start looking more actively for ways to earn, trading on Pendle picks up. The protocol earns more, and the price of PENDLE follows.
The fall of 2025 confirmed this perfectly
And PENDLE held up well. In effect, Pendle has created a separate financial market within DeFi, a market for future yield. And the more capital flows into the ecosystem, the more people will want to manage their yield, which means demand for PENDLE will keep growing too. This is the main reason for the token's resilience: it's tied to a real need, not to crowd sentiment.
— 8Blocks Team
As for what could be improved: the vePENDLE system is currently fairly complex for newcomers. Simpler, more transparent staking would attract more regular users, and the more of them there are, the higher the liquidity and the stronger the whole model becomes
SNX (Synthetix) — correlation ~0.75
What it is: a protocol for issuing synthetic assets (copies of the prices of stocks, currencies, metals).
Users lock SNX as collateral and mint the synthetic stablecoin sUSD, essentially the system's internal currency. This sUSD is then used for trading within the ecosystem. And because people lock their tokens and provide the system with liquidity, they receive a share of the fees from all trades that pass through the protocol.
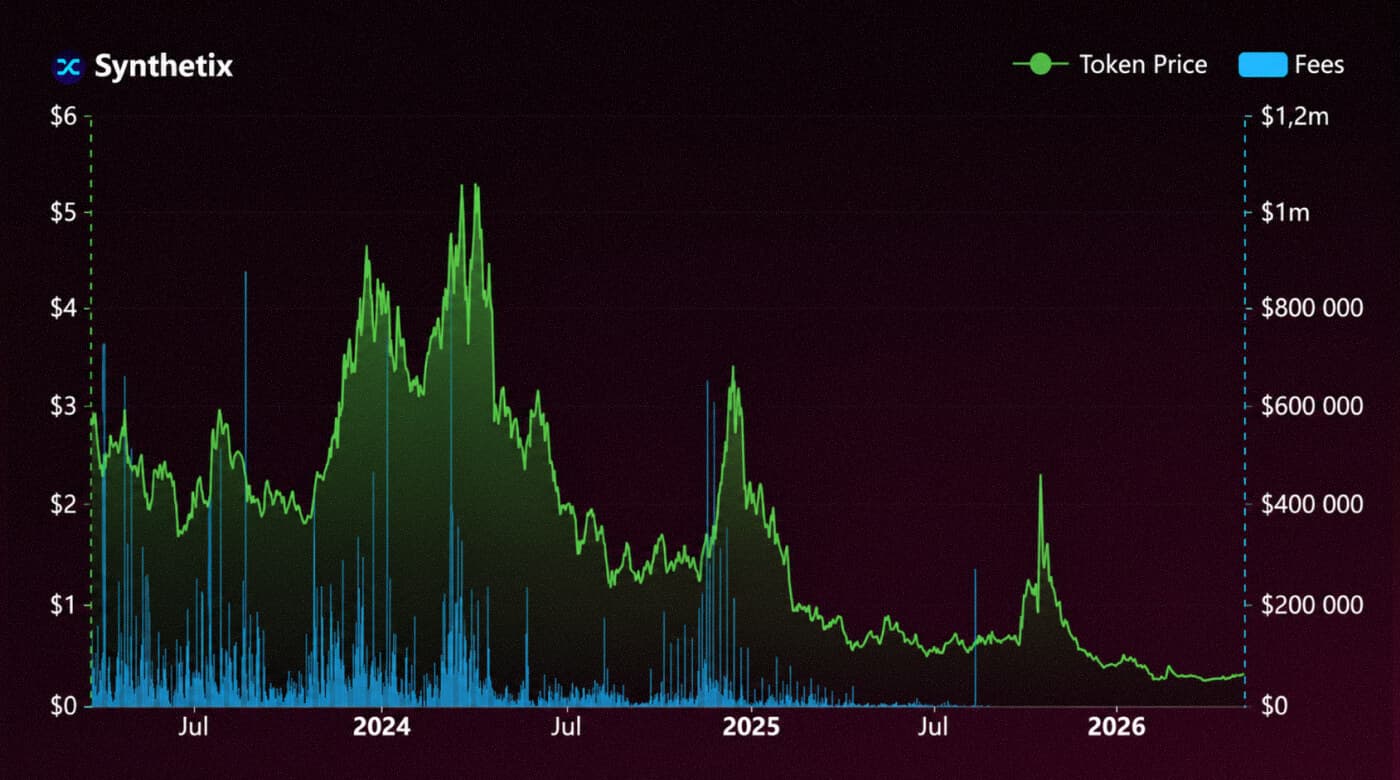
Synthetix: SNX price and protocol fees. Source: DefiLlama
The essence is scale. Synthetix isn't an isolated protocol, it's infrastructure that other applications connect to. The more such applications there are, the more trades pass through the system. And more trades mean more fees, which mean higher income for stakers, which mean higher demand for SNX. The token's price here doesn't depend on a single project, but on the health of the entire ecosystem.
This was clearly on display in the fall of 2025. The market was in turmoil, but Synthetix V3 integrations kept working, and perpetuals trading volumes stayed high.
Fees kept flowing, staking remained attractive, and the price of SNX didn't collapse as sharply as many others did.
And this is the key difference between SNX and most DeFi tokens
Usually, price is tied to the success of a single application. Here, it's tied to the entire ecosystem built on the protocol.
The more projects use Synthetix as a base layer, the stronger the link between real usage and the token's value. In effect, SNX isn't the token of an exchange or a lending protocol, it's an infrastructure asset. And that makes it more resilient.
— 8Blocks Team
That said, the system is complex. For a newcomer, figuring out the mechanics of staking, sUSD, and all these synthetic assets is quite a quest. If the interfaces and interaction with the protocol became simpler and clearer, that would attract more users. And the more people lock SNX and use the system, the higher the liquidity and the stronger the whole model becomes.
TAO (Bittensor) — correlation ~0.68
What it is: a decentralized network for machine learning. Something like a marketplace for AI compute.
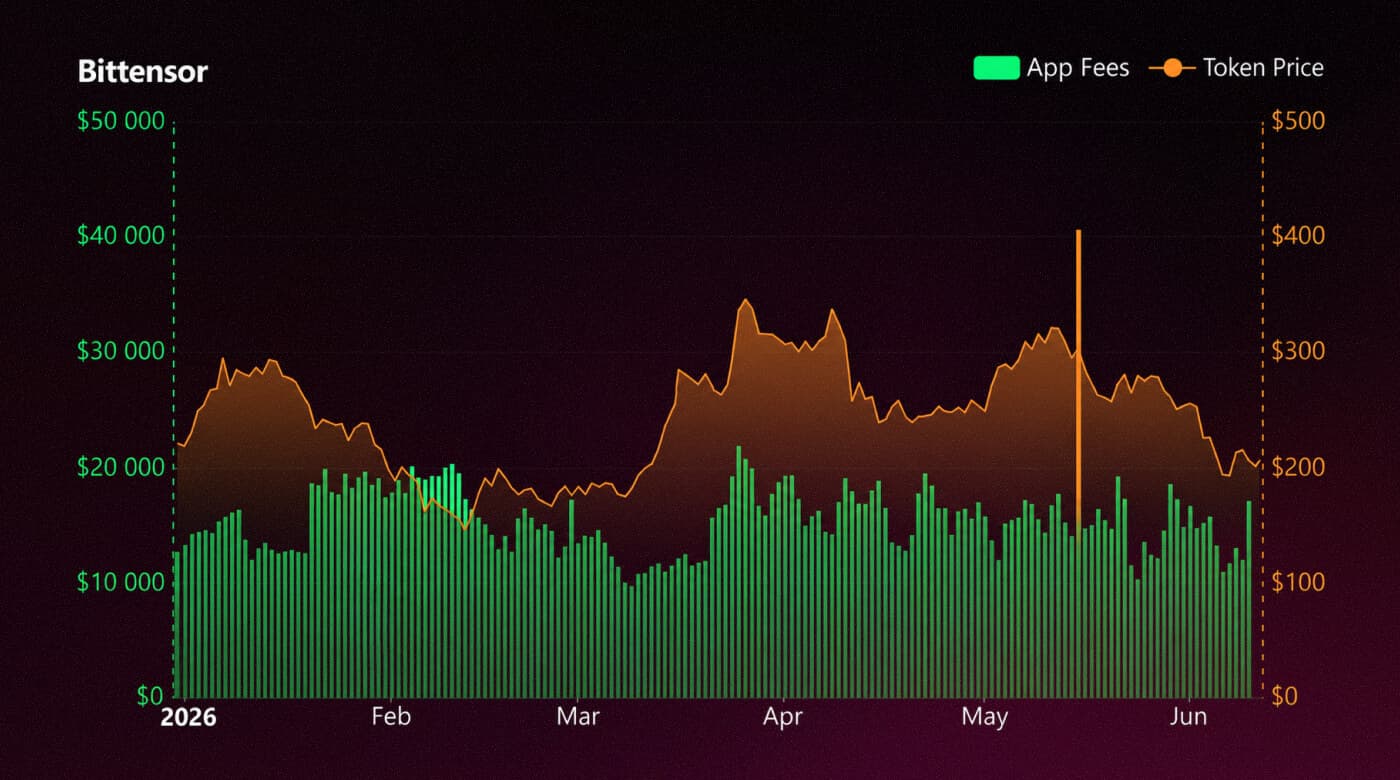
Bittensor: TAO price and App Fees. Source: DefiLlama
As a product metric we used App Fees — actual payments for inference and model training. This is a direct measure of paying demand for AI compute.
Transactions and wallets are activity metrics, not value metrics. App Fees show whether users are actually willing to pay for the product.
And here the mechanics close the loop: more fees = more validator revenue = higher staking appeal = higher demand for TAO.
In October 2025 TAO held up reasonably well. Demand for decentralized AI services didn't disappear: people kept paying for compute, and subnet activity stayed high. Staking remained attractive, and the token didn't collapse along with the market.
SKY (Sky, formerly MakerDAO) — correlation ~0.65
What it is: this is where the DAI stablecoin is issued, and SKY (formerly MKR) insures the protocol.
If collateral falls short, new SKY is minted, diluting holders. If the protocol earns excess profit, it goes toward buying back and burning tokens. The mechanics are harsh but transparent: losses fall on holders, while profit works to reduce supply.
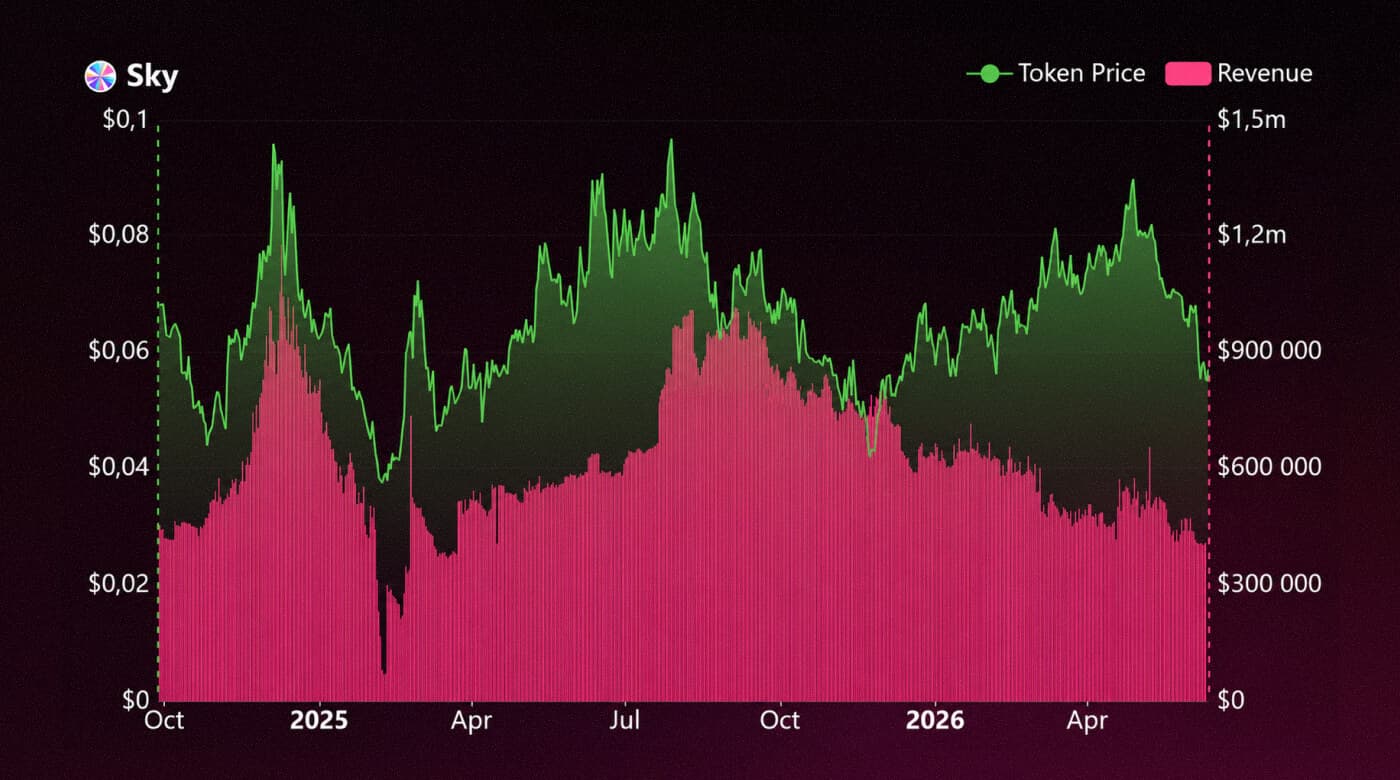
Sky: SKY price and protocol revenue. Source: DefiLlama
SKY's value depends not on market sentiment but on the real health of the ecosystem.
Demand for DAI rises — loans and revenue rise — more funds go toward token buybacks.
Unlike most DeFi projects, here revenue isn't just distributed — it directly reduces supply and creates long-term scarcity.
During the correction, SKY showed resilience. Demand for DAI stayed high, since users prefer stablecoins in periods of uncertainty. The protocol kept generating revenue, and price pressure was noticeably lower than for most altcoins.
One of the lowest correlations in the sample
But this is explained by the structure of the model. Unlike exchanges or lending protocols, where a rise in activity is immediately reflected in earnings, Sky has a time lag between profit, governance decisions, and buybacks. The market reacts to financial results gradually, not instantly.
— 8Blocks Team
Sky's economics resemble a public company more than a typical DeFi protocol. The token's value is driven not by speculative demand but by the protocol's ability to generate profit and allocate capital wisely.
GMX — correlation ~0.45
What it is: a decentralized perpetuals exchange on Arbitrum and Avalanche.
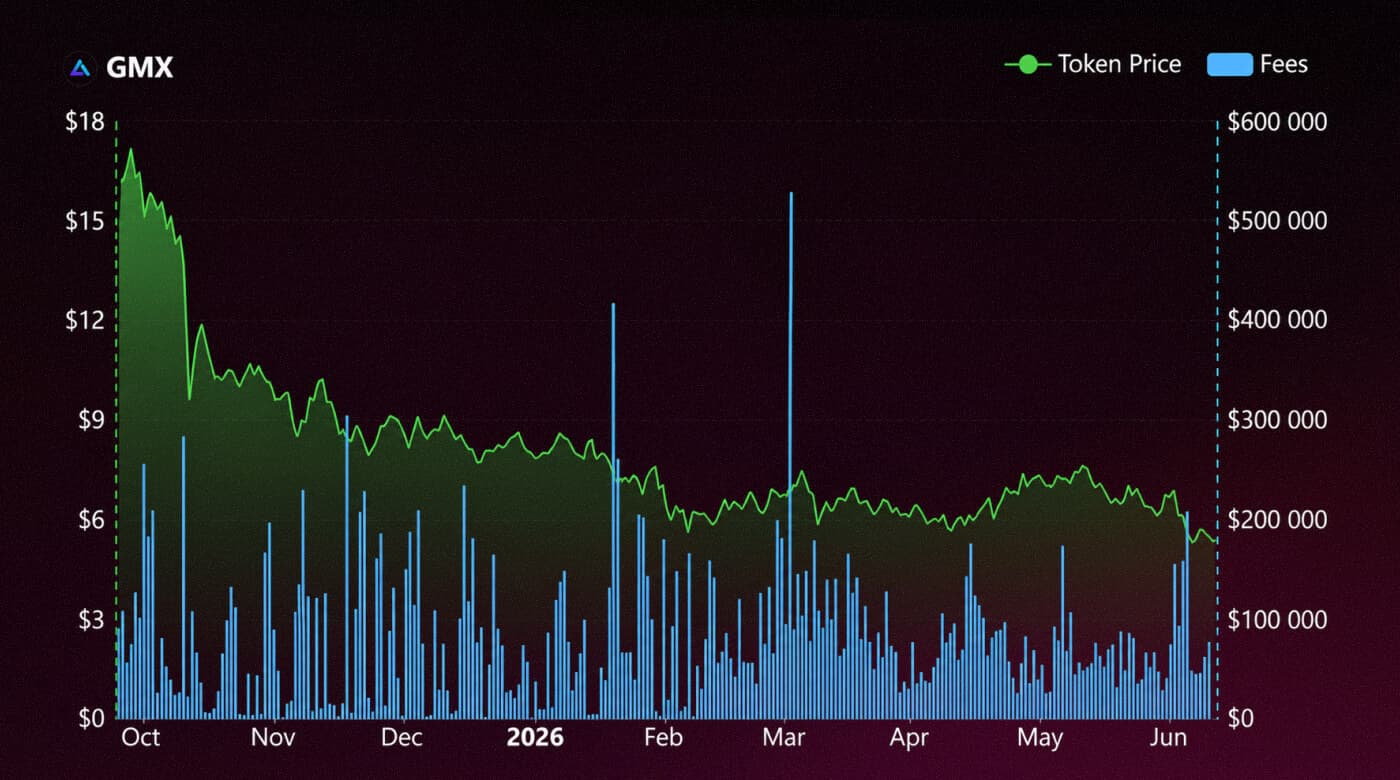
GMX: GMX price and protocol fees. Source: DefiLlama
Fees are the only metric that shows organic protocol usage, stripped of speculative noise.
Unlike wallet counts or transaction counts, fees are something someone actually paid.
When Bitcoin dropped 15%, GMX held up. Trading activity stayed steady, fees kept flowing, and stakers kept earning. But correlation with fees was moderate.
Why is that
Exchange tokens are always more sensitive to the broader market, even when the underlying business is doing fine. That's a feature of the asset class, not a flaw. And what matters here isn't that the correlation is imperfect, but that the token has real yield — unlike 90% of altcoins, where nothing backs the price.
— 8Blocks Team
One thing that could be improved: there's currently no long-term lockup mechanism. Users can exit at any time. Tiered staking with bonuses for longer lockups would likely strengthen holder retention and, in turn, correlation.
What these tokens have in common
Yes, all these projects have different economics. But look closer and only the mechanisms differ — the underlying principle is the same everywhere.
A user uses the product — the protocol earns money — part of that value flows back to token holders.
And this last step (returning value to the token) is exactly what separates strong tokenomics from weak tokenomics.
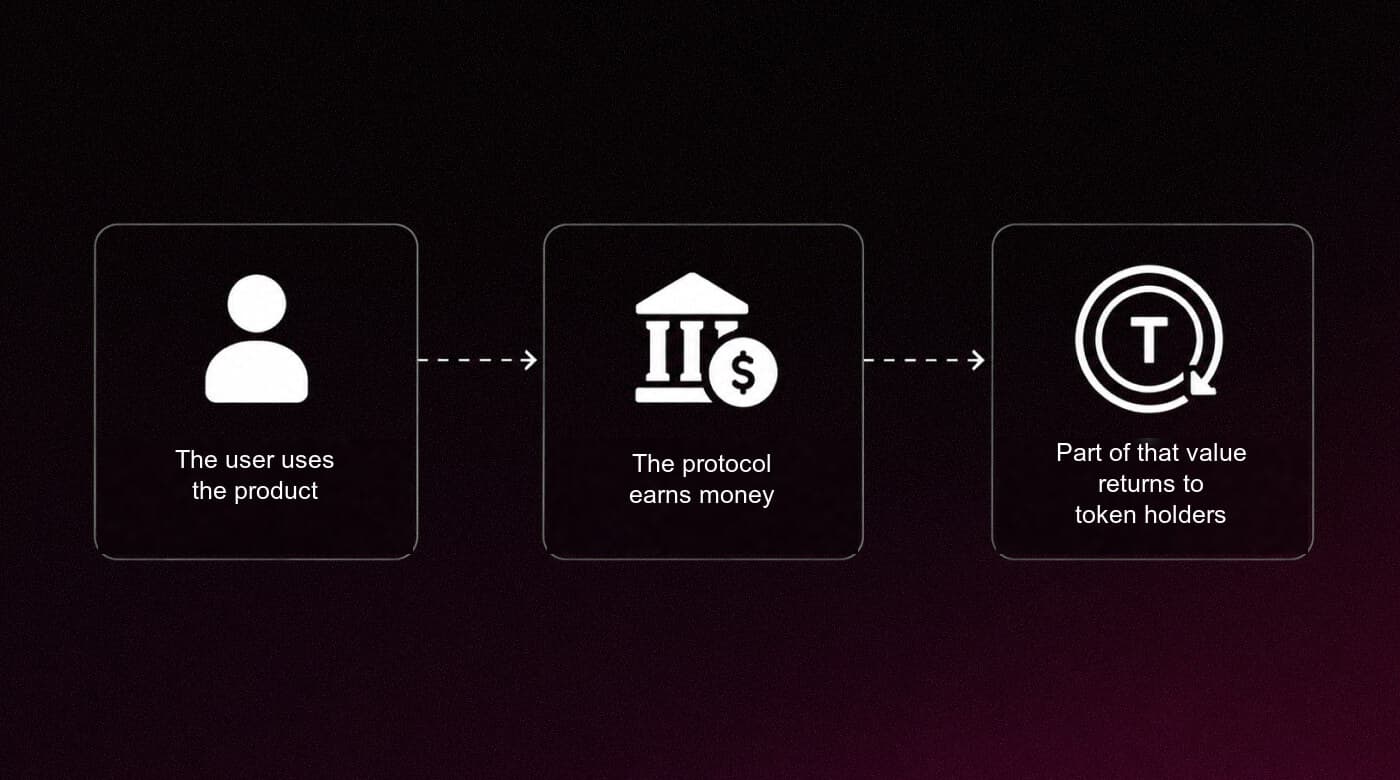
A protocol can be popular and generate millions of dollars in revenue, but if that revenue has no effect on the token's economics, a gap opens up between the product and its price.
In tokenomics research, this distinction is described as value capture (value stays inside the protocol) and value accrual (value passes to token holders).
And the projects in this research solve that problem differently.
- GMX pays out trading fees in ETH/AVAX.
- Hyperliquid directs fees toward buying back HYPE.
- Sky buys back and burns tokens using profit.
- Synthetix closes the loop on demand through mandatory SNX staking.
- Pendle converts yield trading into fees for vePENDLE.
Three shared traits
Tokens that kept their link to the product during the correction share three common traits.
- The token is genuinely needed by the product. It doesn't just sit in a wallet granting voting rights — it does work: it's locked for staking, used as collateral, or grants access to protocol functions. Without the token, the product doesn't work.
- There's a clear mechanism for returning value. Revenue doesn't stay inside the protocol — it's passed to holders through fees, buybacks, burns, or higher staking yield. The fewer manual decisions in this process, the stronger the link.
- Holding the token makes economic sense. Selling means losing access to future fees, yield, or governance. Holding the token pays off even when the market falls.
Instead of conclusions: the end of the narrative era
Every bear phase separates a project's real economics from the stories it tells.
Marketing brings in users, community sustains interest, listing provides liquidity — but none of these factors alone creates token value.
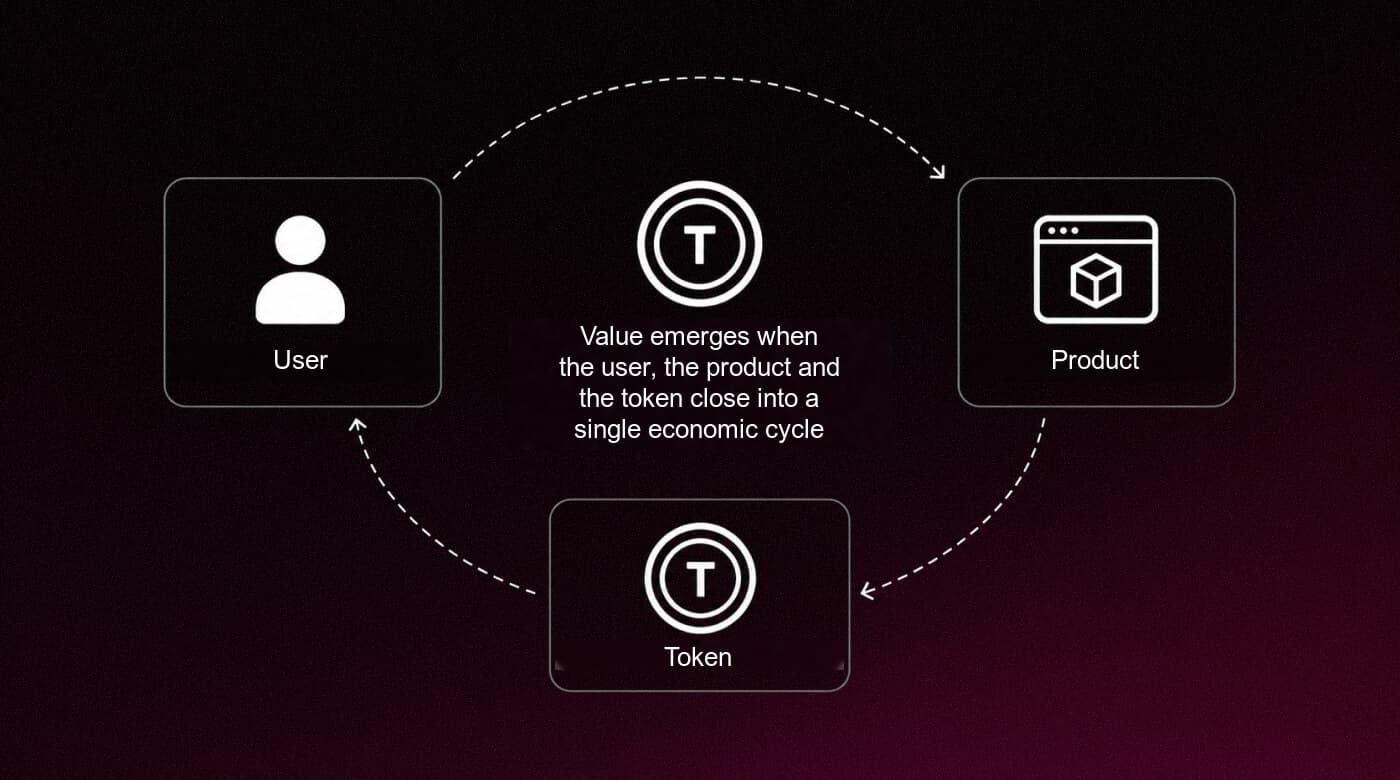
Value emerges when the user, the product, and the token close into an economic cycle.
Today the crypto market is at a point of bifurcation. On one side are assets whose price rests on expectations and sentiment. On the other are tokens whose value reflects the real economics of a product.
The former will keep collapsing with every correction, while the latter will gradually form a new asset class — one the market will start treating not as casino bets, but as working businesses.
8Blocks is a Dubai-based tokenomics audit firm. We help projects across the UAE and the wider MENA region build token models in which product usage, protocol revenue and token demand form a single measurable loop — the structure that VARA and ADGM reviewers, and institutional investors, expect to see documented before capital moves.