How to Launch an Exchange Token That Doesn't End Up Worthless
Every exchange token promises the same things: buybacks, burns, staking, VIP tiers. We took six apart — BNB, OKB, BGB, KCS, MNT and HYPE — and measured how much money actually reaches the market for each. For five of the six it is zero. What works, what doesn't, and why copying someone else's tokenomics is pointless.
One Playbook, Six Different Fates
Every self-respecting crypto exchange today considers it mandatory to issue its own token. The usage mechanics have long since become an industry standard:
- Buyback and burn
- Launchpad and Launchpool for new projects
- Trading fee discounts
- Staking and yield accounts
- Multi-tier VIP status
At first glance it seems enough to open the whitepaper of Binance, OKX, or Hyperliquid, copy the best practices — and success is guaranteed.
But if the mechanics are practically identical, why do the results differ so dramatically?
BNB has held a top-asset position for nearly nine years: market cap ~$83.0B as of August 20, 2026. Hyperliquid's model is considered one of the biggest discoveries of recent years — in under two years HYPE reached a market cap of ~$15.4B. Meanwhile, dozens of other exchange tokens with the same feature set have stagnated for years, never creating meaningful value for holders.
At 8Blocks, we decided to find out why.

The trigger for this research was an inquiry from a crypto exchange that was planning to launch its own token. The project itself never happened, but the analysis we compiled in the process turned out to be too valuable to keep in-house.
— Toni Efren
In this piece we break down the economics and mechanics of six of the largest exchange tokens to answer one question: which of these mechanics actually work for price and market cap, and which exist only for a pretty slide in a marketing deck?
The short answer, if you don't have time to read further: what works is not the buyback per se, but open-market repurchases funded by fees — provided the token has mandatory demand outside the mechanic itself. Everything else — burning from reserves, "supply shock," gas on a dead network, a treasury instead of a product — creates no value. Below are six cases that prove it, with numbers.
For teams building from the UAE this is not an abstract question. VARA in Dubai and ADGM in Abu Dhabi both expect an issuer to describe what the token does and what its economics depend on. A fee discount on an active exchange or gas in a network people use is documentable; an intention to buy tokens back out of future revenue is not.
Methodology
To avoid arguing over taste, we set evaluation criteria. The sample includes six projects: BNB, OKB, BGB, KCS, MNT, and HYPE.
| Token | Exchange | Tokenomics archetype | FDV | Why it's in the sample |
|---|---|---|---|---|
| BNB | Binance | Fixed maximum supply + gradual burn aimed at reducing it | ~$83.0B | Benchmark (segment leader), first mover in almost every mechanism and utility |
| OKB | OKX | Sharp burn aimed at achieving a "supply shock" | ~$2.17B | Shift to an "acute scarcity" model and abandonment of exchange utility |
| BGB | Bitget | Fixed maximum supply + aggressive burn from allocations | ~$1.63B | Popular exchange with aggressive marketing and an elaborate product system |
| KCS | KuCoin | Fixed maximum supply + profit-funded buyback and burn | ~$1.03B | Classic model, implemented quietly and time-tested |
| MNT | Mantle (Bybit ecosystem)* | Enormous share of supply in the treasury, burn-and-mint instead of buyback | ~$3.01B | A token whose main utility is the treasury, not the mechanic |
| HYPE | Hyperliquid | Deterministic, transparent open-market buyback — a predictable deflationary model | ~$69.2B | A fresh take on tokenomics (see "What Works and What Doesn't" for details) |
* MNT is the token of Mantle, an independent DAO and L2 network — legally it is not a Bybit token. Bybit is the ecosystem's largest shareholder and primary distribution channel, which is why the case is included in this exchange-token sample.
** Hyperliquid is a DEX with its own L1, not a centralized exchange. It is included as a reference case: its buyback system is fully deterministic, transparent, and tied to real revenue.
The sample was built not around "six similar models," but as a set of different tokenomics archetypes — so the analysis is substantive rather than repetitive.
The research draws on official whitepapers and tokenomics documents, on-chain burn dashboards, CoinGecko data (price, supply, MC, FDV), DefiLlama (TVL, protocol fees and revenue), and CoinGlass (aggregated exchange data). Some Hyperliquid figures were pulled directly from the node via the public `api.hyperliquid.xyz` API — this makes it possible to verify buyback size without intermediaries.
Data snapshot: August 20, 2026. All figures in the text are current as of this date unless stated otherwise.
Four Terms You Shouldn't Confuse
Before diving in, let's separate the mechanisms that press releases lump together under one word — "buyback." The difference between them is the main takeaway of this research.
- Buyback — purchasing the token on the open market using exchange or protocol funds. Creates real demand: a buyer with money shows up on the exchange. On its own, it does not reduce supply.
- Burn from reserves — destroying tokens the issuer already held and never sold on the market. Reduces nominal supply but creates zero buyers. This is how most "burns" in the industry actually work.
- Buyback + burn — an open-market purchase followed by destruction. The only construction that delivers both demand and deflation at once.
- Lock — temporary removal from circulation with a subsequent release. Affects circulating supply, not total supply, and creates no demand.
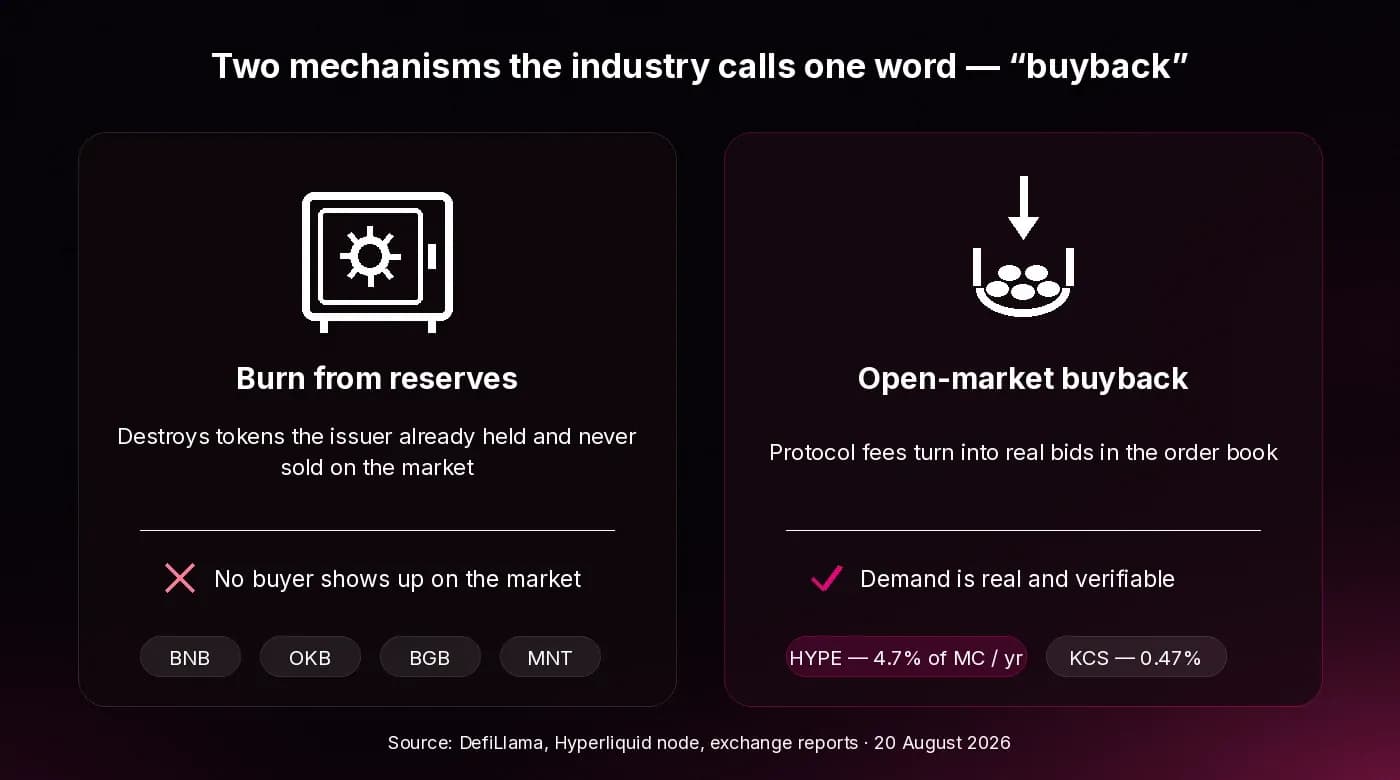
The practical test we use to evaluate each project below: did money actually arrive on the market for the token, and where did that money come from. If the burned tokens never left the issuer's treasury, nothing economically happened except a change in the denominator of the FDV formula.
Now that we've agreed on terms, let's look at the projects.
BNB: A Benchmark Built Over Nine Years
Let's start with the benchmark. BNB is the oldest and largest exchange token on the market. Over nine years, Binance has not merely retained its lead in trading volume and user count — it built an entire ecosystem around the token.
However, what we see today looks almost nothing like BNB in 2017.
The initial issuance was 200M coins. Through regular burning, supply has shrunk to 133.2M as of August 2026. Binance's long-term goal is to bring this number down to 100M.
The original allocation looked like this: 50% (100M) — public offering (ICO), 40% (80M) — the founding team with a four-year vesting schedule, 10% (20M) — angel investors. The ICO ran from July 1 to July 21, 2017; coins could be bought with ETH and BTC. Team vesting was spread evenly over four years: 20% (16M coins) unlocked at TGE, followed by further unlocks at years 1, 2, 3, and 4. Team vesting was fully completed in July 2021. Angel investors, in turn, received their entire allocation (20M coins) at TGE.
— Toni Efren
| % Allocation | BNB coins | Recipient |
|---|---|---|
| 50% | 100M | Public offering (ICO) |
| 40% | 80M | Founding team (4-year vesting) |
| 10% | 20M | Angel investors (unlocked at TGE) |
Table. Issuance allocation (from the BNB Whitepaper)
BNB's market cap at the time of analysis is around $83.0B. MC/FDV = 1.00, meaning all coins are already in circulation: the token has no "overhang" of future unlocks, which is rare in itself for an asset of this size.
Where the Demand Comes From
Demand for BNB rests on several pillars, all of which scale with the size of Binance and BSC.
The first, and probably the main one, is Binance's trading fee discount (25% on spot and margin, 10% on futures). An active trader is effectively forced to hold a stock of BNB to pay less. The larger the exchange's volume, the wider this demand base. This is compulsory, not voluntary, demand — it doesn't depend on whether a trader believes in the token.
The second is BNB Chain gas. BNB serves as the native gas token on BSC, as well as in the decentralized data-storage protocol BNB Greenfield. Every transaction requires BNB, so demand grows alongside network activity. This is a key point we'll return to in the OKB, BGB, and KCS cases: gas creates demand only where the network is actually used. BSC's TVL is $5.20B, the second- or third-largest across all blockchains.
The third is product demand inside the Binance ecosystem: Launchpool, Megadrop, Earn, Loans, Binance Pay. These products lock up BNB for the duration of campaigns, temporarily removing tokens from circulation.
The fourth is DeFi usage on BSC: liquid staking, use as a quote token in AMM pools, as collateral in lending protocols, plus token purchases on the memepad Four.meme.
An indirect but measurable indicator of lock-driven demand is the volume of BNB locked in BSC's TVL. According to DefiLlama, denominated in BNB, the peak was in 2021; today around 7–10M tokens are locked in BSC protocols, i.e. 5–8% of supply.
In addition, BNB can be staked to help secure the BSC network, which runs on a Proof of Staked Authority (PoSA) model — more on the mechanism in Binance Academy's article, with current staking data available on the official BNB Chain page.
How the Burns Work — and What They Are Not
BNB burns run through several mechanisms:
- Auto-Burn: a quarterly algorithmic burn calculated from the number of blocks produced on BSC during the quarter and the average BNB price for that quarter. It replaced the previous Repurchasing Plan, which was in effect through the 17th burn in October 2021.
- BEP-95 real-time burning: 10% of gas fees on BSC are burned in every block. The 10% figure is not fixed by protocol — it can be changed through governance — but it hasn't changed in five years.
- Pioneer Burn Program: insurance against double issuance when erroneously lost user tokens are returned.
- Beacon Chain Fusion Burn: a one-time burn of 110,000 BNB when the Beacon Chain was decommissioned.
Totals as of August 20, 2026, per the bnbburn.info dashboard:
| Mechanism | Burned, BNB | % of 200M |
|---|---|---|
| Auto-Burn (quarterly) | 67,211,172 | 33.6% |
| Real-Time Burn (BEP-95) | 293,658 | 0.15% |
| Community Burn | 95,694 | 0.05% |
| Beacon Chain Fusion Burn | 110,000 | 0.06% |
| Zero Address Locked | 99,245 | 0.05% |
| Total | 67,809,770 | 33.9% |
Table. Breakdown of BNB burns (bnbburn.info, August 20, 2026)
Scale of the most recent quarterly burns: the 36th burn (Q2 2026) — 1,615,828 BNB, worth around $1.00B at an average price of $620.01; the 37th (Q3 2026) is estimated at 1,679,372 BNB, around $970M. On an annualized basis that's roughly $4B, or ~4.8% of BNB's market cap per year.
For comparison: despite BSC's popularity, BEP-95 has burned only 293.7K tokens in total over its entire lifetime — 0.15% of maximum supply. In other words, the bulk of the deflation comes from the quarterly mechanism, not from gas fees.
— Toni Efren
And here's an important caveat that the industry almost always skips. Auto-Burn is not an open-market buyback. The formula is tied to BNB's price and block count, and the tokens burned are ones Binance already holds in reserve and has never sold. It puts no direct pressure on the order book: no $1B buyer shows up in a quarter. What works isn't the purchase — it's its absence. Binance voluntarily gives up the option to ever sell these coins, and does so by a public formula anyone can verify.
That's exactly why Auto-Burn is effective for Binance and useless for exchanges that copy it: it amplifies demand that already exists — from fees, gas, and products — but doesn't create it. Remove the fee discount and BSC, and all that's left is an algorithm shrinking a denominator.
| Metric | Value |
|---|---|
| Price | $623.25 |
| Circulating supply | 133,163,410 BNB |
| Market cap (MC) | ~$83.0B |
| Total supply | 133,163,410 BNB |
| Maximum (original) supply | 200,000,000 BNB |
| FDV | ~$83.0B |
| MC/FDV | 1.00 (all coins in the market) |
| Burned to date | 67.81M (33.9%) |
| Burn pace | ~$4B/year (~4.8% of MC), from reserves |
| BSC TVL | $5.20B |
Table. Current BNB metrics (August 20, 2026)
Key takeaway on BNB. For nine years, BNB was built not as a token but as a mandatory piece of infrastructure: without it, trading is more expensive and using the network is impossible. Here, the burn is not an engine but an amplifier. You can copy the Auto-Burn formula; you cannot copy the #1 exchange by volume and a blockchain with $5.2B in TVL that give that formula its meaning.
OKB: A Reform That Broke the Model
OKB is a case that shows how a sharp change in tokenomics can produce an impressive price chart while destroying value at the same time.
The initial issuance (2017) was 300M OKB. Per tokenomist, the allocation looked like this:
| Allocation | % | Coins |
|---|---|---|
| User distribution and market development | 60% | 180M |
| Public sale | 20% | 60M |
| Ecosystem development fund | 10% | 30M |
| Team (4-year vesting) | 10% | 30M |
Team vesting was completed by 2018, so the token was fully unlocked well before the 2025 reform.
Previously, OKB had a full suite of utilities: OKX trading fee discounts (5 tiers based on balance), use in ecosystem products (Earn, Jumpstart), the weekly "Happy Friday" campaign (a share of fees distributed to holders), plus gas and DeFi usage on X Layer.
The historical OKB Burn model had run since 2019: 30% of spot fees went toward buying back and burning tokens. In total, before the reform, 213.7M OKB had been burned — 71% of the original maximum supply. This was, in fact, the right construction: a revenue-funded open-market buyback plus a burn.
What Happened in August 2025
On August 13, 2025, OKX announced a reform. On August 15, a one-time burn of 65,256,712.097 OKB took place — "previously repurchased and reserve" tokens. On August 18, the OKB smart contract was upgraded: the mint and burn functions were removed permanently. Supply was fixed at 21M — 7% of the original 300M. Further issuance and burns are now technically impossible. Reserves and undistributed tranches were destroyed; the token became "ownerless," 100% in circulation. There is no longer a regular open-market buyback.
— Toni Efren
The market reacted instantly. Per CoinGecko data, within an hour of the announcement OKB rose from around $47 to $126 (+172% intraday), and by late September–early October 2025 it reached a peak of roughly $220–230.
But What Happened to the Utility
Simultaneously with the "supply shock," OKX removed the very reason traders held the token. The wording in the exchange's official FAQ (last updated August 6, 2026) leaves no ambiguity:
"Can OKB be used to offset exchange trading fees? — No. OKB can't be used to offset exchange trading fees, and holding OKB doesn't affect fee discount tiers."
— X Layer upgrade and OKT/OKB asset handling FAQ, OKX
In other words, OKB no longer provides a fee discount or fee-tier progression. Of the full utility set, only two remain relevant:
- native gas token of the X Layer network (an L2 on Polygon CDK);
- use in DeFi protocols on X Layer (quote token in AMM pools, collateral in lending).
The problem is that X Layer turned out to be severely underused: the network's TVL at the time of analysis is $111.6M. For comparison, BSC's is $5.20B — 47 times larger. Meanwhile OKX itself consistently ranks among the world's top three exchanges by volume. The token and the business were deliberately decoupled.
| Utility | Before the reform | After the reform |
|---|---|---|
| OKX fee discounts (5 tiers) | Yes | No |
| Impact on fee tier | Yes | No |
| Earn, Jumpstart | Yes | No |
| "Happy Friday" campaign | Yes | No |
| Regular open-market buyback (30% of spot fees) | Yes | No |
| Native X Layer gas | Yes | Yes |
| DeFi on X Layer (quote, collateral) | Yes | Yes |
Table. OKB utility comparison, before vs. after the reform
The Math the Press Releases Don't Show
Here's where it gets interesting. OKB's price did rise — from ~$45–47 before the reform to $103.40 on August 20, 2026, a 2.2–2.3x increase. On a price chart, the reform looks like a triumph.
Now let's calculate in dollars, not price per unit:
| Point in time | Total supply | Price | FDV |
|---|---|---|---|
| Before the reform (early August 2025) | 86.3M (300M − 213.7M burned) | ~$47 | ~$4.06B |
| Post-reform peak (early October 2025) | 21M | ~$227 | ~$4.77B |
| Trough (March 2026) | 21M | ~$76 | ~$1.59B |
| August 20, 2026 | 21M | $103.40 | $2.17B |
Table. OKB valuation before and after the reform. 8Blocks calculation based on CoinGecko data and OKX burn reports
Bottom line: the price rose 2.2x, while the project's full valuation fell 46% — from ~$4.06B to $2.17B. A 76% reduction in supply "ate" more value than the price gain created. The peak lasted less than two months; by March 2026 the valuation was already 2.5x below the pre-reform level, and even the current recovery to $2.17B hasn't brought the project back to its starting point.
Key takeaway on OKB. A one-time burn without underlying demand is a reshuffling of value between rows in a table, not the creation of value. A supply shock produces a nice chart for a few weeks, after which the price settles back to a level justified by demand. OKX made three mistakes at once: it removed a mechanism that worked (the fee-funded open-market buyback), it removed mandatory demand (the discount), and it left the token to lean on an L2 nobody needs. Whatever mechanic remains — "a fixed 21M, like Bitcoin" — isn't a demand mechanic at all.
| Metric | Value |
|---|---|
| Price | $103.40 |
| Circulating supply | 21,000,000 OKB |
| Market cap (MC) | $2.17B |
| Total supply | 21,000,000 OKB |
| FDV | $2.17B |
| MC/FDV | 1.00 (all coins in the market) |
| Change in FDV vs. pre-reform level | −46% |
| Open-market buyback | None |
| X Layer TVL | $111.6M |
Table. Current OKB metrics (August 20, 2026)
BGB: Big Burn Numbers and Not a Single Buyer
Bitget Token is an example of an aggressive strategy with big numbers — and not a single dollar landing on the market for the token.
BGB launched on July 26, 2021 at a starting price of $0.0585, with a maximum supply of 2B tokens. In December 2024, Bitget migrated the Bitget Wallet Token (BWB) into BGB, merging the two assets into one — this event is often mistakenly treated as the token's "launch."
Allocation per the official whitepaper:
| Allocation | % | Coins |
|---|---|---|
| Replacement of BFT (Bitget Token v1) | 25% | 500M |
| Team incentives | 20% | 400M |
| New user acquisition | 15% | 300M |
| Brand development (KOL) | 15% | 300M |
| BGB ecosystem | 15% | 300M |
| User protection fund | 10% | 200M |
How the Burning Happened
January 2025 — a one-time burn of 800M tokens. As stated directly in the whitepaper, these were "800 million tokens belonging to the team — 40% of total supply." After this, total supply dropped to 1.2B, and the entire balance was declared to be in circulation.
From Q2 2025 — quarterly formula-based burns. The whitepaper defines the formula as: the volume of BGB spent as gas in Bitget Wallet GetGas accounts during the quarter, multiplied by a preset constant and divided by the average quarterly BGB price plus a price anchor, plus a fixed burn amount. The goal is to bring total supply down to 100M, with a direct nod to the BNB model.
Quarterly burn trend:
| Quarter | BGB burned |
|---|---|
| Q1 2025 | 30,006,905 |
| Q2 2025 | 30,001,053 |
| Q1 2026 | 3,000,330 |
| Q2 2026 | 3,010,400 |
Table. Quarterly BGB burns, per official Bitget announcements
Note the order of magnitude: the pace fell tenfold in a year — from 30M to 3M per quarter. At that pace, the path from today's 911M down to the stated 100M target would take about 67 years.
September 2025 — 440M tokens transferred to the Morph Foundation: 220M were burned immediately, the remaining 220M went into a lock with 2%-per-month vesting.
In total, by August 2026 around 1.089B coins had been burned — 54% of maximum supply. Total supply now stands at 910.9M.
Demand for BGB is driven by several factors: a 20% spot fee discount, VIP status and profit-sharing, access to Launchpad, Launchpool, and PoolX. BGB also serves as the gas token in Bitget Wallet, and since November 2025 — as gas and governance token on the Morph network. At the same time, there is no open-market buyback whatsoever — every burn comes from allocations and from BGB's use as gas.
— Toni Efren
Why It Doesn't Work
Bitget ranks among the top 5 exchanges by trading volume, which in theory should support demand for the token. In practice, there are three problems.
- Not a single dollar of revenue lands on the market for the token. The 800M in January 2025 were team tokens that had never been sold. The 220M via the Morph Foundation are the same story. The quarterly burns come from allocations, per a formula tied to wallet gas spend. The impressive headline "54% of supply burned" actually means "we decided not to release half of what we minted onto the market."
- Weak Morph network performance: TVL is $23.3M. Gas on a network this size creates no measurable demand.
- Opaque source. There is no way to verify the quarterly burn formula from outside: the "preset constant," "price anchor," and "fixed amount" are all set by Bitget itself and, per the whitepaper text, are "periodically revised." The drop from 30M to 3M per quarter illustrates exactly what such revisions look like in practice.
| Metric | Value |
|---|---|
| Price | $1.79 |
| Circulating supply | ~700.0M BGB |
| Market cap (MC) | $1.26B |
| Total supply | 910.9M BGB |
| FDV | $1.63B |
| MC/FDV | 0.77 |
| Burned to date | ~1.089B (54% of 2B) |
| Open-market buyback | None |
| Morph TVL | $23.3M |
Table. Current BGB metrics (August 20, 2026)
Key takeaway on BGB. Aggressive burns and big numbers create the appearance of strong tokenomics. But burning from one's own allocations is economically equivalent to a decision "not to dilute holders" — good hygiene, not a driver. Without an open-market buyback and without a network people actually use, BGB remains a marketing tool rather than a fundamental asset. Tellingly, MC/FDV = 0.77: the market is pricing in a discount for the remaining 211M unlocked-but-outstanding tokens.
KCS: The Right Mechanic at the Wrong Scale
KCS is the second-oldest exchange token in the sample after BNB, and the only one of the "classic" designs where the buyback happens on the open market, funded by exchange profit. In other words, the construction is right. The problem is size.
The token launched in 2017 with a maximum supply of 200M. The initial distribution was: 100M (50%) — public sale, 70M (35%) — team with vesting, 30M (15%) — investors and advisors with vesting through 2019. As of August 20, 2026, total supply is 142.16M, with 137.16M in circulation. Over nine years, 57.8M tokens — 28.9% of the original issuance — have been destroyed.
Two Mechanics That Actually Work
1. KCS Bonus — fee revenue distributed to holders. 50% of KuCoin's daily commission revenue is distributed among holders of 6+ KCS, proportional to their share. This is a rare industry example of revenue passed directly to token holders, tied to actual exchange volume rather than a management decision. Historical yield was estimated in the 3–30% annual range; by 2026 it had fallen to 0.8–2.3% annually — the holder base grew faster than fee revenue.
2. Profit-funded buyback and burn. KuCoin directs 10% of quarterly net profit toward buying back KCS on the secondary market, followed by sending it to a burn address. The goal is to bring supply down to 100M.
And this is where the numbers turn sobering. The 65th burn (December 2025) was 53,595 KCS. At $7.25, that's about $0.39M. Annualized, that's roughly $4.7M in buybacks, or 0.47% of market cap. For comparison: Hyperliquid's equivalent figure is 4.7% — ten times higher. At this pace, the 100M-token target is unreachable within the project's lifespan.
KCS also provides a 20% trading fee discount when the "KCS Pay Fees" option is enabled, access to the KuCoin Spotlight launchpad (100 KCS average-balance threshold), and a spot in a 12-tier VIP system.
What Doesn't Work
KCC (KuCoin Community Chain) is dead. The network's TVL is $0.77M — three orders of magnitude below BSC and two below Morph. KCS's role as KCC's gas token creates no measurable demand. Of the six projects in the sample, this is the clearest example of "having your own blockchain" not being a utility in itself.
A regulatory hit wiped out part of the base. In January 2025, KuCoin paid roughly $300M under a settlement with the U.S. Department of Justice (a $112.9M criminal fine plus $184.5M in forfeiture) for operating without a license and AML violations, and exited the U.S. market for at least two years. Even earlier, in September 2024, the exchange closed new user registration in the Netherlands. In February 2026, Austria's regulator suspended new client onboarding for the European division pending fixes to AML staffing gaps — even though KuCoin had obtained its MiCA license in November 2025.
The transmission mechanism matters here: KCS Bonus and the buyback are funded by fees and profit. Regulatory restrictions cut volume → cut fees → cut both holder payouts and buyback size. A token tied to revenue also inherits revenue's risks.
| Metric | Value |
|---|---|
| Price | $7.25 |
| Circulating supply | 137.16M KCS |
| Market cap (MC) | $0.99B |
| Total supply | 142.16M KCS |
| FDV | $1.03B |
| MC/FDV | 0.96 |
| Burned to date | 57.8M (28.9% of 200M) |
| Latest burn (65th, December 2025) | 53,595 KCS (~$0.39M) |
| Open-market buyback | Yes, ~0.47% of MC per year |
| KCS Bonus yield | 0.8–2.3% annually |
| KCC TVL | $0.77M |
Table. Current KCS metrics (August 20, 2026)
Key takeaway on KCS. The design is correct: a profit-funded open-market buyback plus direct fee distribution to holders. But the mechanic scales with the exchange, and KuCoin hasn't outgrown the market in nine years — and has since lost the U.S. As a result, both streams — the bonus and the buyback — have shrunk to amounts too small to move the price. The right mechanic at the wrong scale fails exactly the same way the wrong mechanic does.
MNT: A Treasury Instead of a Mechanic
MNT is the only case in the sample where the token doesn't formally belong to an exchange. Mantle is an independent DAO and L2 network that grew out of BitDAO; Bybit is the ecosystem's largest participant, distribution channel, and primary source of retail demand. This matters for our question: MNT shows what happens when a token has enormous money and no mandatory demand mechanic.
History: A Conversion, Not a Launch
Mantle began as BitDAO, backed by Bybit since 2021. In July 2023, holders approved converting BIT into MNT at a 1:1 ratio, with balances snapshotted on July 17, 2023. Unconverted BIT was destroyed. On paper this produced an impressive deflation figure, but economically it was a ticker change, not a reduction in what holders held.
Current Structure: Half the Issuance Sits in the Treasury
| Metric | Value |
|---|---|
| Total supply | 6,219,316,795 MNT |
| Circulating | 3,302,294,383 MNT (53%) |
| In Mantle's treasury | ~2.9B MNT (47%) |
This is exactly where the MC/FDV = 0.53 comes from — the worst figure in the sample. Half the issuance sits outside the market and can be deployed at any moment by DAO decision. The market prices in this overhang.
Mantle's treasury is the largest among exchange tokens: around $1.85B per the official Mantle dashboard, roughly 70% of it held in MNT itself, the rest in BTC, ETH, and stablecoins. The money is genuinely put to work: Mantle Index Four (MI4), an institutional index fund with a $400M anchor investment from the treasury; the neobank UR; grants; and the EcoFund.
What the Token Has
- Mantle Network gas. MNT is the native gas token of an OP Stack L2. Since September 2025 the network has moved to ZK proofs (OP-Succinct), cutting the withdrawal window from 7 days to ~6 hours.
- Bybit discounts. 25% on spot and 10% on futures when paying fees in MNT, plus an MNT Multiplier of up to 1.5x for VIP-tier calculations.
- Governance. 1 MNT = 1 vote, quorum of 200M MNT, proposal threshold of 200K MNT. Votes genuinely happen: MIP-31 secured 240M votes in favor; MIP-34 approved a 30,000 ETH credit line for Aave DAO. Of the six projects in the sample, this is the only functioning governance system.
- Bybit Earn. The Mantle Vault on Bybit reached $200M AUM by March 2026.
What the Token Doesn't Have
There is no open-market buyback at all — not from Bybit fees, not from network revenue, not from the treasury. The deflationary loop is limited to a protocol-level burn-and-mint equilibrium: part of gas fees is burned, part goes to validators. At current network activity, these burn volumes are negligible.
And here's the main problem — network activity has collapsed. Per DefiLlama, Mantle Network's TVL:
| Date | TVL |
|---|---|
| August 2025 | ~$233M |
| February 2026 | ~$131M |
| April 2026 (peak) | ~$685M |
| August 20, 2026 | $70.4M |
Table. Mantle Network TVL (DefiLlama)
From the April peak to August, the network lost 90% of its TVL in four months. The February–April 2026 spike had all the hallmarks of incentivized liquidity: it arrived for a program and left once it ended. If gas is the token's primary utility, and the network is shedding 90% of its activity, the demand mechanic stops working right along with it.
| Metric | Value |
|---|---|
| Price | $0.4855 |
| Circulating supply | 3.302B MNT |
| Market cap (MC) | $1.60B |
| Total supply | 6.219B MNT |
| FDV | $3.01B |
| MC/FDV | 0.53 (worst in the sample) |
| Open-market buyback | None |
| Treasury | ~$1.85B (~70% in MNT) |
| Mantle Network TVL | $70.4M (−90% from the April 2026 peak) |
Table. Current MNT metrics (August 20, 2026)
Key takeaway on MNT. A $1.85B treasury is not tokenomics — it's a balance sheet. It funds products, grants, and institutional funds, but creates zero reason to buy MNT on the market: holders get no buyback, no revenue share, and votes don't convert into cash flow. Worse, 47% of the issuance sitting in the treasury is a structural overhang the market discounts directly (MC/FDV of 0.53). The "raise capital first, figure out demand later" model hasn't produced demand in three years.
HYPE: A Buyback That Actually Works
Hyperliquid is the only project in the sample where the buyback isn't decorative — and the only one where anyone can verify the buyback size themselves, without relying on a press release.
A Genesis Without Venture Capital
The token launched on November 29, 2024. No VC rounds, no public sale: 31% of supply (310M HYPE) was airdropped to roughly 94,000 protocol users. The remainder is split between future emissions and community rewards (~38.9%), core contributors (~23.8%), and a foundation.
This matters more than it seems. An exchange token with a VC round has a structural seller: an investor who entered at $0.05 will sell into any rally. HYPE has no such seller by design — only contributor unlocks, most of which fall in 2027–2028.
The Assistance Fund: A Mechanic You Can Verify in 10 Seconds
Hyperliquid's fees don't go into a company's pocket. The overwhelming majority is automatically, at the protocol level, routed into the Assistance Fund — an on-chain address, `0xfefe...fefe`, that buys HYPE on Hyperliquid's own spot order book. This isn't a management decision or a quarterly announcement — it's code.
Anyone can verify the fund's status — the node's public API returns the balance and the cumulative purchase value:
```
POST https://api.hyperliquid.xyz/info
{"type":"spotClearinghouseState","user":"0xfefefefefefefefefefefefefefefefefefefefe"}
```
As of August 20, 2026, the response shows:
| Assistance Fund metric | Value |
|---|---|
| HYPE balance | 46,516,280 HYPE |
| Cumulative purchase value (entryNtl) | $1,238,582,738 |
| Average purchase price | $26.63 |
| Market value as of 8/20/2026 | ~$3.22B |
| Share of maximum supply | 4.65% |
Table. Assistance Fund data, pulled directly from the Hyperliquid node (`api.hyperliquid.xyz/info`)
Cross-checking against an independent source: per DefiLlama, Hyperliquid's cumulative holders revenue since inception is $1.196B, and $727.3M for the trailing 12 months. The discrepancy with the fund's purchase total is under 4%. Two independent counting methods produce the same result: the entire stated fee flow really did go into the open-market buyback.
No other project in the sample allows for this kind of cross-check — because open-market buybacks are either absent entirely (OKB, BGB, MNT), two orders of magnitude smaller (KCS), or aren't buybacks at all but reserve burns (BNB).
The Numbers as a Percentage
Buyback yield = $727.3M / $15.40B = 4.7% of market cap per year. That's how much money enters the market for the token every year.
| Token | Open-market buyback, $/year | % of MC | Funding source |
|---|---|---|---|
| HYPE | ~$727M | 4.7% | Protocol fees, automatic |
| KCS | ~$4.7M | 0.47% | 10% of quarterly profit |
| BNB | $0 (reserve burn, ~$4B/year) | 0% | Binance reserves |
| OKB | $0 | 0% | — |
| BGB | $0 (burn from allocations) | 0% | Allocations |
| MNT | $0 | 0% | — |
Table. Real open-market buybacks. 8Blocks calculation based on DefiLlama, CoinGecko, the Hyperliquid node, bnbburn.info, and official exchange reports
Two Additional Demand Channels
The buyback isn't the only pillar.
HyperEVM gas. HYPE is the native gas token of Hyperliquid's EVM layer. The network's TVL is $1.395B. Unlike X Layer ($111.6M), Morph ($23.3M), and KCC ($0.77M), this is a network with real activity, and gas on it creates real demand.
Staking and discounts. Staking HYPE yields roughly 2–2.5% annually and unlocks trading fee discount tiers ranging from 5% to 40%, depending on stake size. The mechanic resembles Binance's discount, but is tied to a locked, not merely held, balance.
HIP-1 and HIP-3. Spot ticker listings go through a Dutch auction, and the bids are burned. Deploying a custom perpetuals market under HIP-3 requires a large HYPE stake. Cumulative burns so far total under 1M tokens (total supply is 999.02M out of 1B) — a symbolic contribution, but pointed in the right direction.
Honest About the Risks
We would not recommend copying the HYPE model blindly. Three things about it are weak:
- MC/FDV = 0.22 — the worst figure in the sample. Only 222M of the 1B tokens are in circulation. 412M are reserved for future emissions, 241M sit on non-circulating addresses. The main contributor unlocks fall in 2027–2028. A buyback of 4.7% of MC per year will have to compete with this supply.
- Dependence on a single product. Nearly all revenue comes from perpetual futures fees. Hyperliquid's share of the perp-DEX market fluctuates between 38–44%; a strong competitor emerging would hit buyback volume directly.
- Regulatory status is undefined. The protocol has no legal entity in the conventional sense, and access for U.S. users is restricted. The "97% of fees to token holders" model could be reclassified in some jurisdictions.
| Metric | Value |
|---|---|
| Price | $69.21 |
| Circulating supply | 222.45M HYPE |
| Market cap (MC) | $15.40B |
| Total supply | 999.02M HYPE |
| Maximum supply | 1,000,000,000 HYPE |
| FDV | $69.20B |
| MC/FDV | 0.22 |
| Open-market buyback, trailing 12 months | ~$727M (4.7% of MC) |
| Accumulated by Assistance Fund | 46.52M HYPE ($1.24B at purchase price) |
| Hyperliquid L1 TVL | $1.395B |
Table. Current HYPE metrics (August 20, 2026)
Key takeaway on HYPE. What works isn't "a buyback" — it's a specific construction: a deterministic, on-chain, non-discretionary open-market buyback funded by protocol fees, combined with independent mandatory demand (gas on a network people actually use), and no structural seller in the form of venture funds. Remove any one of these four elements and you're back to one of the previous five cases.
Summary Table: The Same Mechanics, Different Results
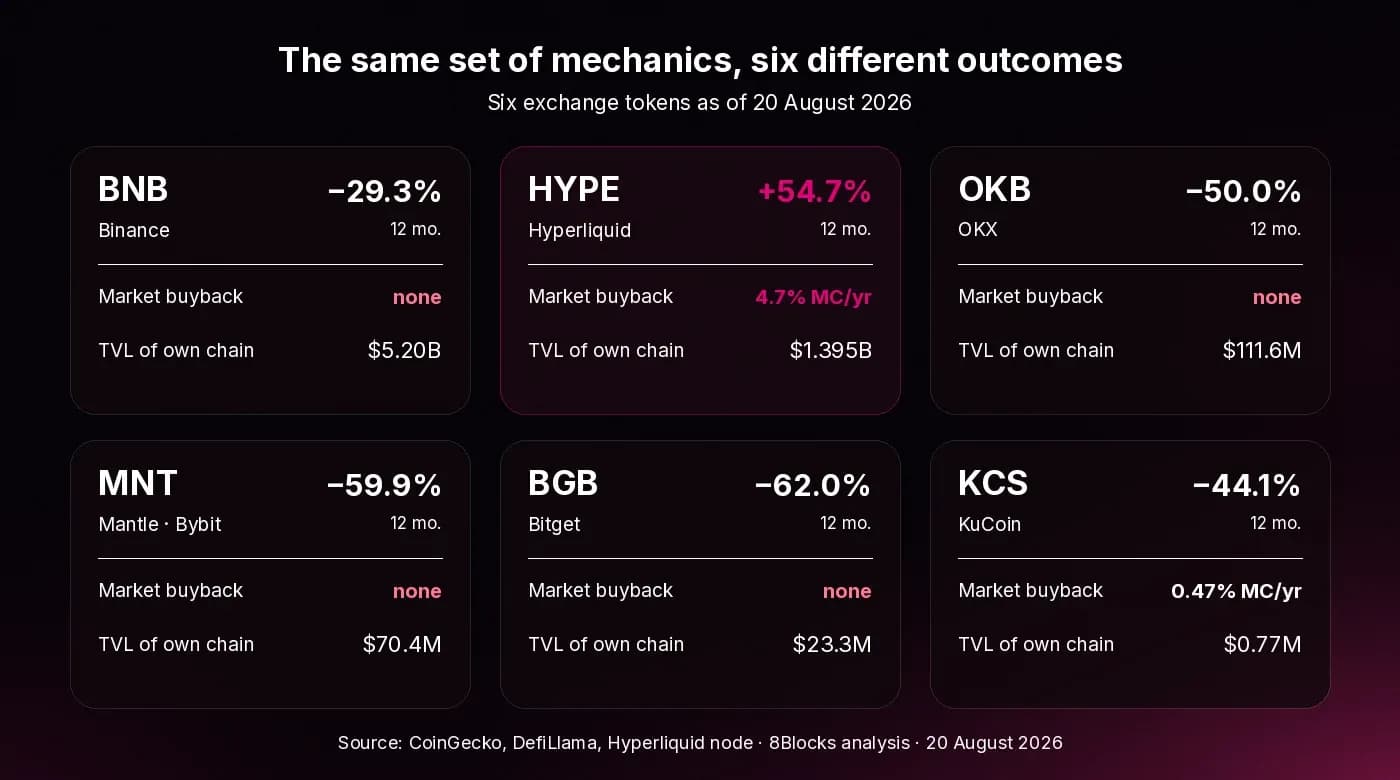
| Mechanic | BNB | OKB | BGB | KCS | MNT | HYPE |
|---|---|---|---|---|---|---|
| Open-market buyback | No | No (existed pre-2025) | No | Yes, ~0.47% MC/yr | No | Yes, ~4.7% MC/yr |
| Burn | Yes, from reserves (~$4B/yr) | One-time in 2025, now impossible | Yes, from allocations | Yes, from repurchased tokens | Gas only (burn-and-mint) | Yes, HIP-1 auctions |
| Deterministic formula | Yes (Auto-Burn) | — | Partial (constants set by exchange) | No ("10% of profit") | No | Yes, on-chain |
| Exchange fee discount | Yes (25%/10%) | No (removed) | Yes (20% spot) | Yes (20%) | Yes (25%/10% Bybit) | Yes (5–40% staking tiers) |
| Native network gas | Yes, BSC | Yes, X Layer | Yes, Morph | Yes, KCC | Yes, Mantle | Yes, HyperEVM |
| TVL of that network | $5.20B | $111.6M | $23.3M | $0.77M | $70.4M | $1.395B |
| Launchpad / Launchpool | Yes | No | Yes | Yes | Yes (Bybit) | No |
| Functioning governance | Limited | No | No | No | Yes | Yes (validators) |
| VC round at genesis | No | No | No | No | Yes (BitDAO) | No |
| MC/FDV | 1.00 | 1.00 | 0.77 | 0.96 | 0.53 | 0.22 |
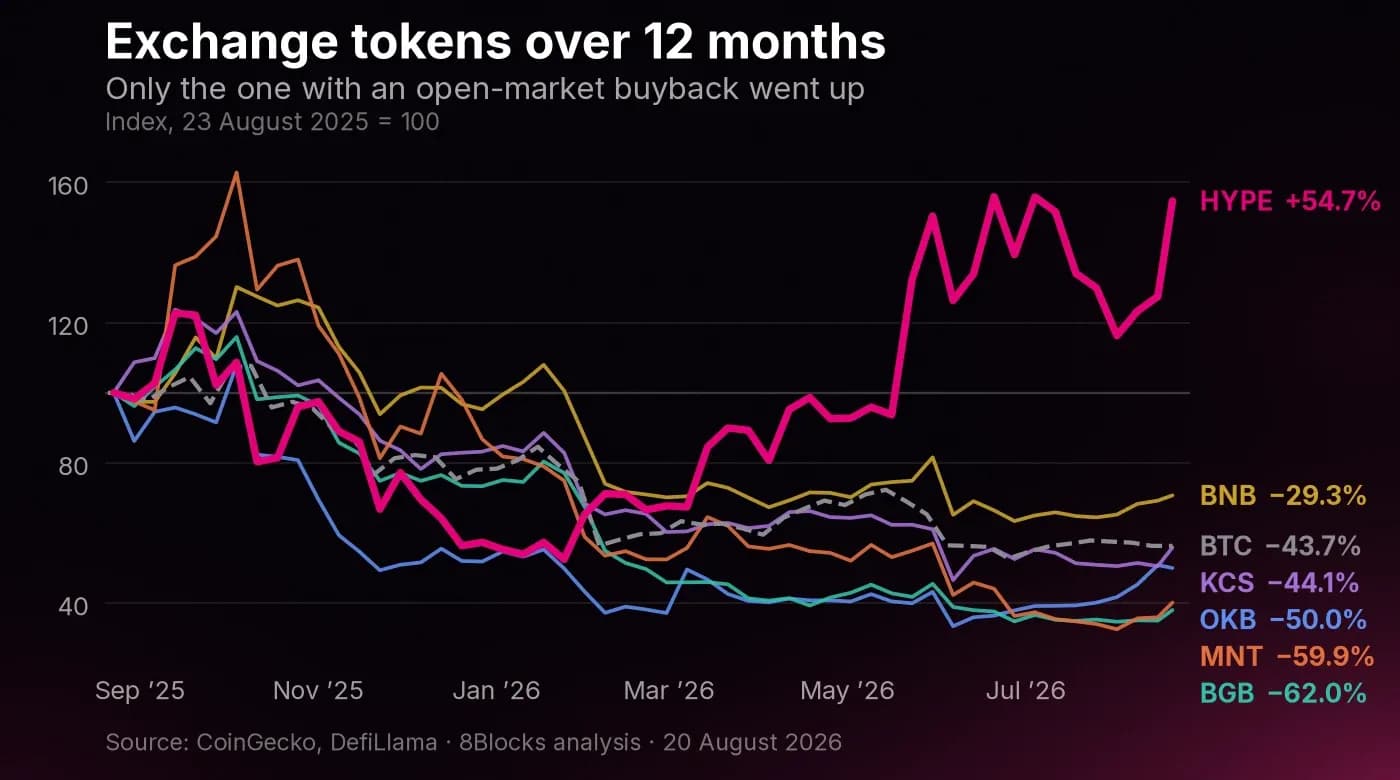
| 12-month price change (8/23/2025 → 8/20/2026) | −29.3% | −50.0%* | −62.0% | −44.1% | −59.9% | +54.7% |
Table. Summary matrix of mechanics and results. Prices — CoinGecko/DefiLlama; TVL — DefiLlama; as of August 20, 2026. For reference: BTC over the same period, −43.7%.
* The baseline date is August 23, 2025 — already after the reform, at the top of a speculative spike ($206.88). That's why OKB shows −50%. From the pre-reform level (~$47), the price actually rose 2.2x — but the project's full valuation fell 46% over the same period (see the OKB section). Both facts are true at once; that's the essence of the case.
The first thing the table shows: the mechanics are almost identical across all six. Buyback, burn, discounts, gas, launchpad, VIP — every one of these exists everywhere. What differs isn't the mechanics but what fills them.
Second: the only token that gained value during a down year for the market is the one with a real open-market buyback of 4.7% of market cap per year. HYPE added 54.7% while BTC lost 43.7%, and the other five exchange tokens fell between 29% and 62%. The gap to the benchmark is 98 percentage points.
What Works and What Doesn't: Six Rules
1. Open-market buybacks work. Burns from reserves don't
This is the central distinction of the entire research. When Binance burns $1B of BNB in a quarter, or Bitget burns 800M BGB, not a single buyer shows up on the order book: tokens the issuer already held are simply destroyed. Economically this is a commitment not to dilute holders — useful, but passive.
When Hyperliquid's Assistance Fund spends $727M in a year, that money physically buys HYPE on the order book. The difference between the two constructions is the difference between "we won't sell" and "we're buying."
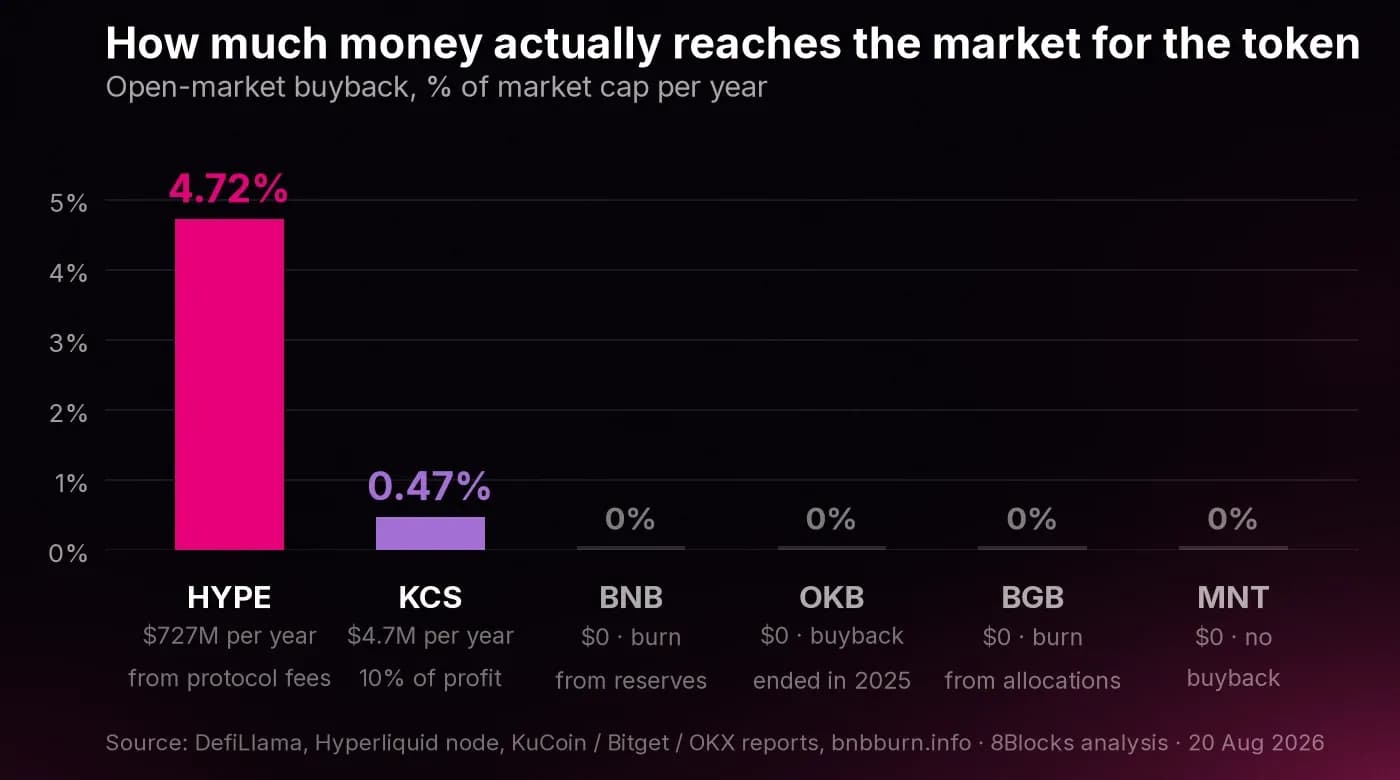
The litmus-test question for any tokenomics: how much money landed on the market for the token over the past year, and where did it come from? If the answer is "zero," there is no buyback, whatever the whitepaper calls it.
2. The mechanic is an amplifier, not an engine. Mandatory demand is the engine
BNB doesn't hold up because of Auto-Burn — it holds up because trading is more expensive without BNB on the world's largest exchange, and because you can't use a network with $5.2B in TVL without it. Auto-Burn is an amplifier on top of that.
OKX ran a near-perfect natural experiment: it kept the scarcity formula and removed mandatory demand. The result was a 46% drop in project valuation. It's the cleanest piece of evidence in our sample: scarcity without demand creates no value.
3. Your own blockchain isn't a utility. A blockchain people use is
Five of the six projects have their own network on which the token serves as gas. TVL spans four orders of magnitude — from $0.77M (KCC) to $5.20B (BSC). Gas creates demand proportional to activity, and activity doesn't appear just because an L2 launched.
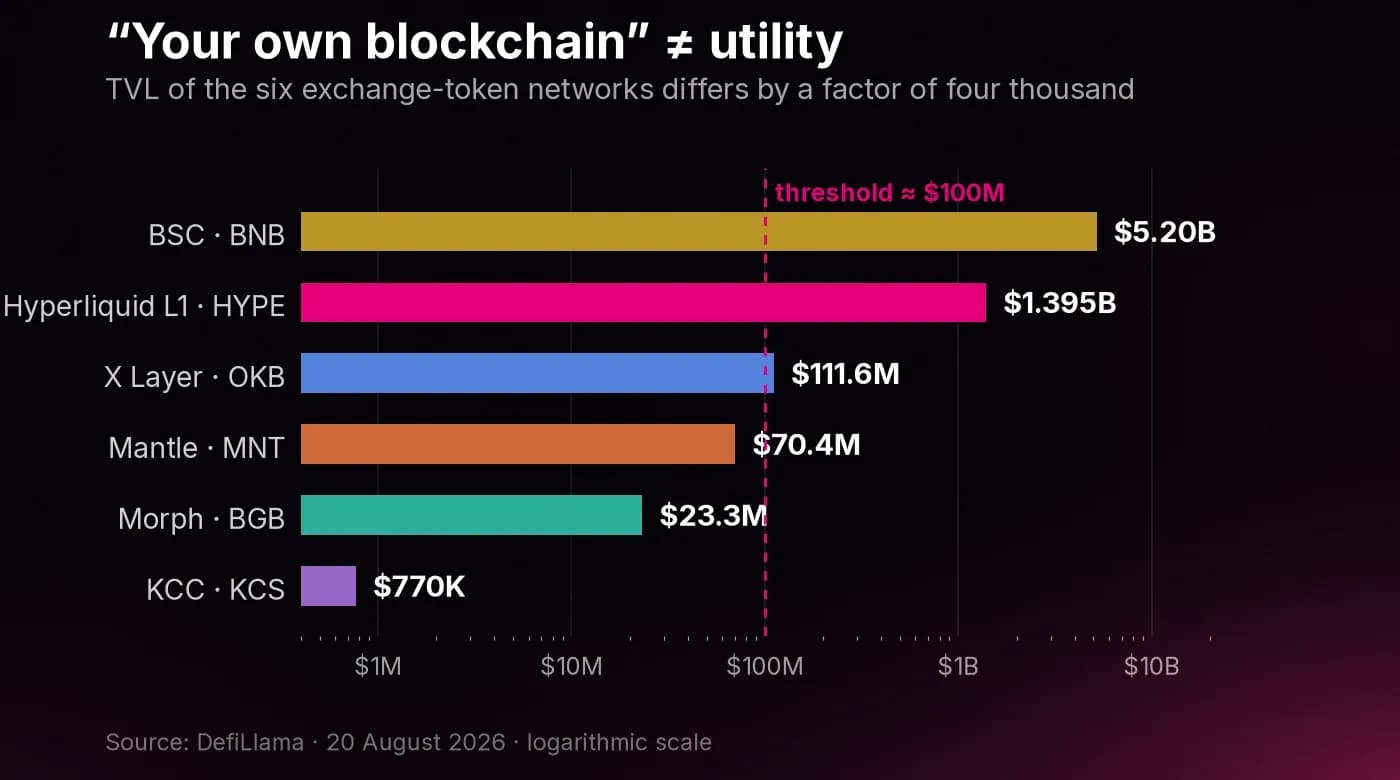
Based on our sample, the order of magnitude below which "gas" stops being an argument in tokenomics is roughly $100M in TVL. KCC, Morph, and Mantle are all at or below that today.
4. A supply shock is an event, not a model
Shrinking supply produces a spike lasting a few weeks. After that, the price reverts to a level justified by demand — except now the project has no buyback, no utility, and no ability to change course (OKB's mint and burn functions have been permanently removed from the contract).
A one-time burn makes sense in exactly one scenario: as a one-off cleanup of overhang ahead of launching a working mechanic. As a replacement for a mechanic, it doesn't.
5. An opaque formula devalues the mechanic
BGB announces quarterly burns using a formula in which the preset constant, price anchor, and fixed amount are all set by the exchange itself and "periodically revised." The result of that revision: from 30M tokens per quarter in 2025 to 3M in 2026 — a tenfold drop.
For Hyperliquid, verification takes one HTTP request to a public node. The difference in trust isn't rhetorical — it shows up in the price.
6. The token inherits the business's risks but doesn't protect against them
KCS demonstrates the transmission mechanism: regulatory restrictions → falling volume → falling fees → a simultaneous decline in both holder payouts and buyback size. A token tied to revenue amplifies both the upside and the downside.
The practical takeaway: before tying a token to revenue, you need to understand how durable that revenue actually is. The mechanic isn't insurance against a regulatory or reputational hit — it's the conduit for it.
What Follows If You're Launching an Exchange Token
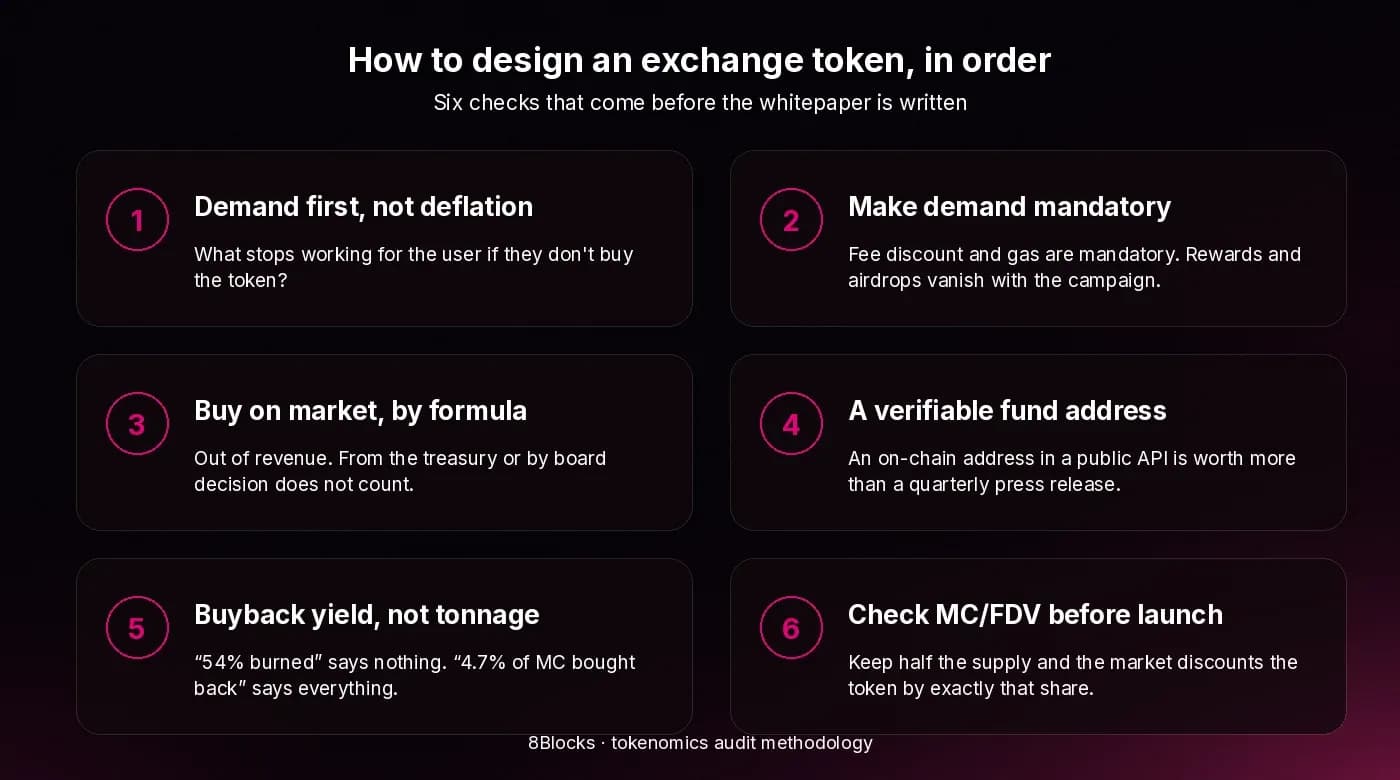
The design sequence that follows from the six cases:
- Start with demand, not deflation. Answer this: what stops working for a user if they don't buy the token? If the only answer is "they get fewer marketing rewards," there shouldn't be a token.
- Make demand mandatory, not incentive-based. A fee discount on an active exchange and gas on a network people use are mandatory demand. Airdrops, giveaways, and badges are incentive-based — they disappear along with the campaign.
- If you do a buyback, do it from the open market, by formula, and out of revenue. All three conditions together. From the treasury doesn't count. By board decision doesn't count. From profit you calculate yourself counts only halfway (the KCS case).
- Publish a verifiable address. An on-chain buyback-fund address that anyone can query via a public API is worth more than a quarterly press release with a nice infographic.
- Track buyback yield, not absolute numbers. "54% of supply burned" says nothing. "4.7% of market cap bought back in a year" says everything.
- Check MC/FDV before launch. If more than half the issuance stays with you, the market will discount the token by exactly that share — as with MNT (0.53).
- Avoid taking venture money against the token if you can. A structural seller on the order book cancels out the buyback's effect.
- Don't copy BNB. Binance's model works because of Binance's position, not because of the Auto-Burn formula. A new exchange has no such position, so a copied formula will just burn reserves with no effect.
This is exactly why we wrote this piece: copying someone else's tokenomics makes no sense — what works isn't the mechanics, but how tightly they're tied to a specific business's specific economics. Every time, you have to run the numbers again.
Frequently Asked Questions
What is an exchange token, and why does an exchange need one?
An exchange token is an asset issued by a crypto exchange that gives holders fee discounts, access to the platform's products, and sometimes a share of its revenue. For the exchange, it provides customer retention (to keep the discount, a trader holds a stock of the token) and a financing channel for the ecosystem. As of August 20, 2026, the combined market cap of the six largest exchange tokens is around $104.4B, of which $83.0B belongs to BNB.
How does a buyback differ from a burn?
A buyback is purchasing the token on the open market with the issuer's money: a real buyer shows up on the exchange. A burn is destroying tokens the issuer most often already held in reserves: supply shrinks, but no buyer appears. Of the six sampled projects, a real open-market buyback exists only for HYPE (~$727M over 12 months) and KCS (~$4.7M).
Why does BNB work while OKB doesn't, if the mechanics are similar?
Because the mechanics sit on top of different demand. BNB gives a 25% discount on the largest exchange's spot fees and serves as gas for a network with $5.20B in TVL. After the August 2025 reform, OKB provides no discount at all — per OKX's official FAQ, "OKB can't be used to offset exchange trading fees" — and serves as gas for the X Layer network, with $111.6M in TVL. The scarcity stayed; the demand disappeared.
Does burning tokens guarantee a price increase?
No. OKB is the cleanest counterexample: supply was cut by 76% (from 86.3M to 21M), the price rose 2.2x, and the project's full valuation fell over the year from ~$4.06B to $2.17B — a 46% drop. Reducing supply redistributes value among units; it doesn't create value.
What is buyback yield, and how is it calculated?
Buyback yield is the share of market cap the issuer buys back from the market over a year: annual buyback volume divided by market cap. For HYPE that's $727.3M / $15.40B = 4.7%. For KCS, around 0.47%. For BNB, OKB, BGB, and MNT — zero, because there's no open-market buyback. It's the only metric that lets you compare different projects' "buybacks" against each other.
Is having your own blockchain enough for a token to have demand?
No — network activity is what matters. In the sample, five tokens serve as gas for their own networks, but TVL differs by a factor of four thousand: KCC — $0.77M, Morph — $23.3M, Mantle — $70.4M, X Layer — $111.6M, Hyperliquid L1 — $1.395B, BSC — $5.20B. Below roughly $100M in TVL, gas utility creates no measurable demand for the token.
Which exchange token model is best today?
Based on the past 12 months, it's the Hyperliquid model: a deterministic on-chain open-market buyback funded by protocol fees, plus gas on a network people actually use, plus no venture overhang. HYPE gained 54.7% during a period when BTC lost 43.7% and the other five exchange tokens fell 29–62%. That said, the model has a weak point: MC/FDV of 0.22 and large contributor unlocks scheduled for 2027–2028.
Can you just copy Binance's tokenomics?
No. Binance's Auto-Burn destroys around $4B a year from its own reserves and functions as an amplifier of demand that already exists — from the #1 exchange's fee discounts and from gas on a network with $5.2B in TVL. For an exchange without that position, a copied formula would just shrink the number in the FDV denominator without creating a single buyer.
Sources and Limitations
Data sources. Price, supply, market cap, and FDV — CoinGecko (snapshot as of August 20, 2026). Network TVL, protocol fees, and revenue — DefiLlama. BNB burns — the bnbburn.info dashboard. Hyperliquid Assistance Fund data — the public node API `api.hyperliquid.xyz/info`, methods `spotClearinghouseState` and `tokenDetails`. Issuance allocation and mechanics — official whitepapers and help centers of Binance, OKX, Bitget, KuCoin, Mantle, and Hyperliquid. Aggregated exchange volume data — CoinGlass.
Limitations.
- All market figures are a single-date snapshot. Valuations, MC/FDV ratios, and buyback yield will change along with price; the conclusions about the mechanics will not.
- HYPE's annual buyback volume is calculated from DefiLlama's holders revenue over 12 months and cross-checked against the Assistance Fund's accumulated purchase value. A month-by-month buyback breakdown isn't available directly from the API.
- The estimate of BNB's Auto-Burn at "~$4B per year" is extrapolated from the two most recent quarterly burns and depends on BNB's price and BSC's block count.
- The pre-reform OKB valuation (~$4.06B) is calculated as total supply (86.3M) × price (~$47). Public sources disagree on how much of that supply counted as circulating, which is why we compare FDV rather than market cap.
- KCS's annual buyback volume is estimated from the last disclosed burn (the 65th, December 2025, 53,595 KCS). KuCoin does not publish either the size of quarterly profit or the methodology behind it, so this estimate is approximate.
- DefiLlama and CoinGecko data is used for research purposes with attribution to the source.
We run these reviews out of Dubai and keep seeing the same local pattern: an exchange token launches with a buyback on the slide and, twelve months later, the numbers show no money reaching the order book. The cheapest moment to correct that is before the whitepaper is signed off, not after the listings.
This material was prepared by the 8Blocks team. We audit and design tokenomics: we calculate which mechanics will actually work for your specific economics, and which will burn your budget and reputation instead. To have your case reviewed — submit a request.